
“How do I import GA4 data into Looker Studio?”
Digital marketer
“How do I connect GA4 with Looker Studio?”
“Is there a way to integrate Google Analytics 4 and Google Sheets?
In 2020, Google introduced a new version of Google Analytics–Google Analytics 4 or GA4. It will lead the charge in web analytics and Google Analytics 3 (Universal Analytics) will be discontinued on July 1, 2023. Marketers need to adjust to new environments. Apart from setting up new web analytics installation, setting up new dashboards follows.
How to Connect GA4 with Looker Studio
This article shows two options on how to import GA4 data to Looker Studio. Option 1 is using a free Google connector. Option 2 is using a paid third-party connector. In either option, go to Looker Studio to start.
You can also connect GA4 to Google Sheets.
Option 1: Built-In Connector (Free)
The first option to import GA4 data to Looker Studio is to use the built-in connector. It’s free and is enough to start building dashboards.
Create Data Source
1 – Go to Looker Studio.
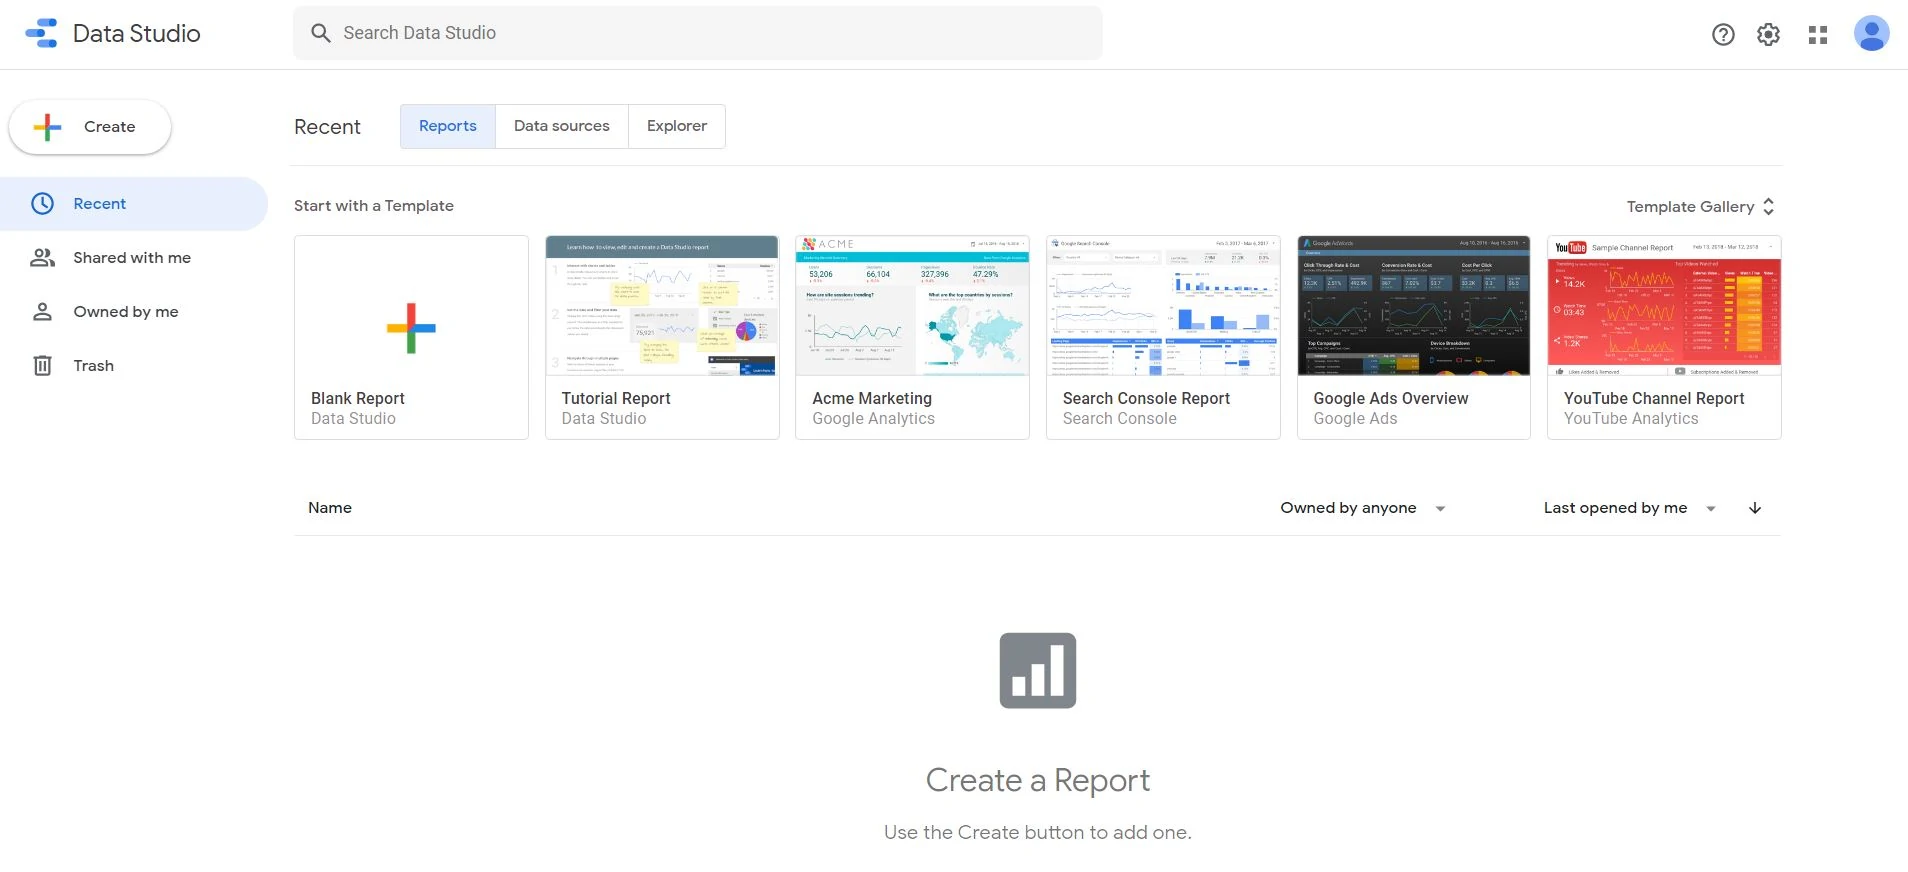
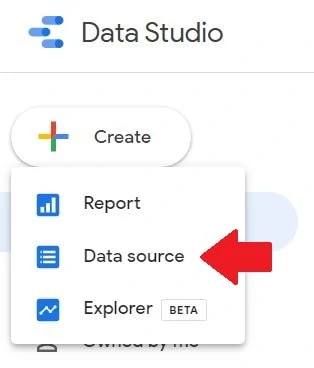
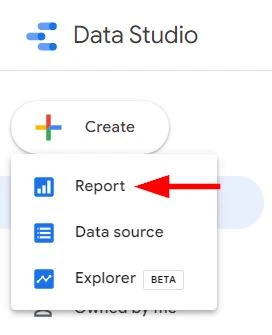
2 – Click on + Create in the top left. Then click on Data source.
3 – Fine and choose Google Analytics.
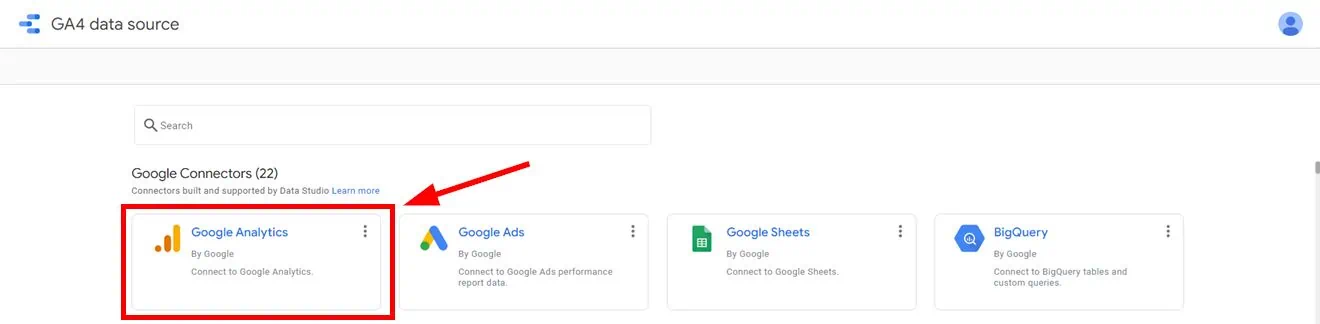
4 – Once inside, click on the Authorize button if it appears. Then click on Allow. This authorizes email access.
After which, you see a list of Google Analytics accounts. These accounts are the ones the authorized email has access to. So, the email should have access first from GA to proceed.
5 – Choose the appropriate Account and appropriate GA4 property. Know the label and names of your Google accounts. Another note is that the email you’re using should have access to the GA4 property. Otherwise, ask for help from your web analysts. The example below is for the GA4 merchandize store.
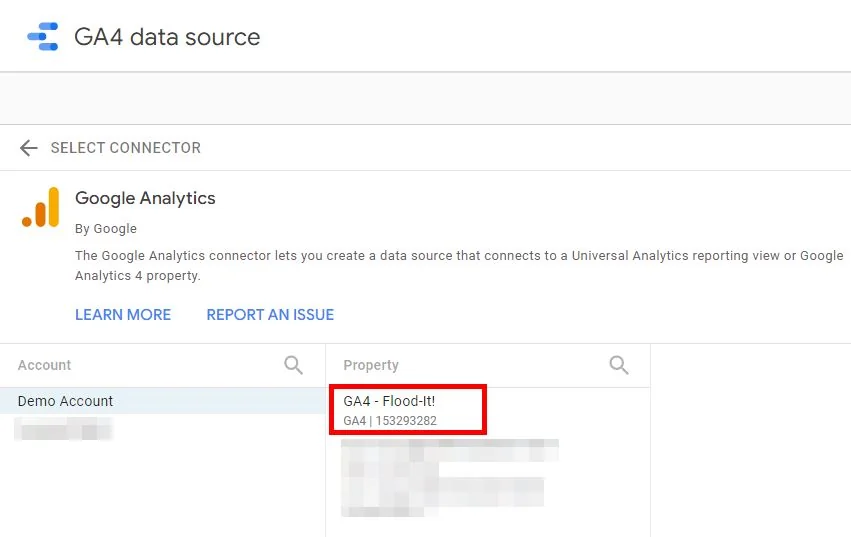
6 – Click on Connect on the upper right.
Viola! This data source is now saved to your Looker Studio workspace.
Create Dashboard
The next phase is to create a dashboard from the GA4 data source.
1 – Go to Looker Studio.
2 – Click on + Create in the top left. Then click on Data source.
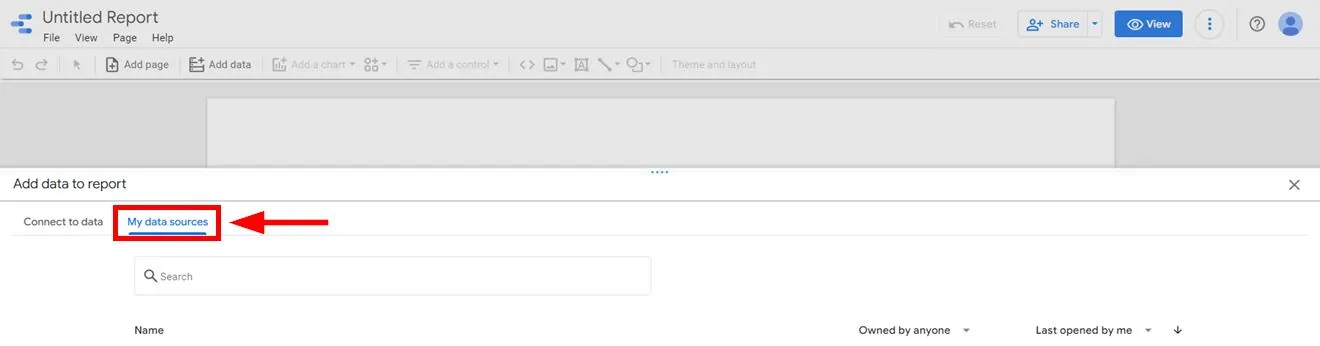
3- Once inside, click on My data sources in the navigation.
4 – Find and click on the Data source you added earlier.
5 – Click on the Add button on the bottom right.
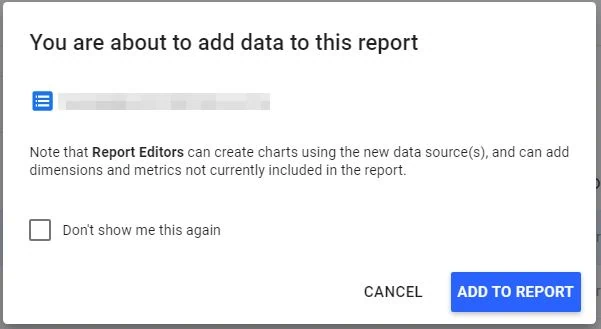
6 – Click on the Add to Report button if it appears.
7 – Name your dashboard on the upper left.
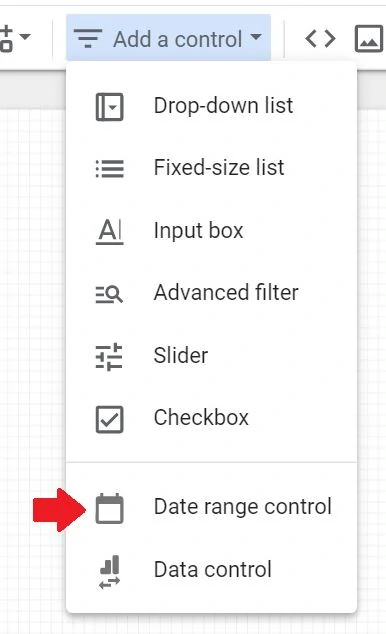
8 – Click on Add a control from the top. Click on Date range control and drag it on the canvas.
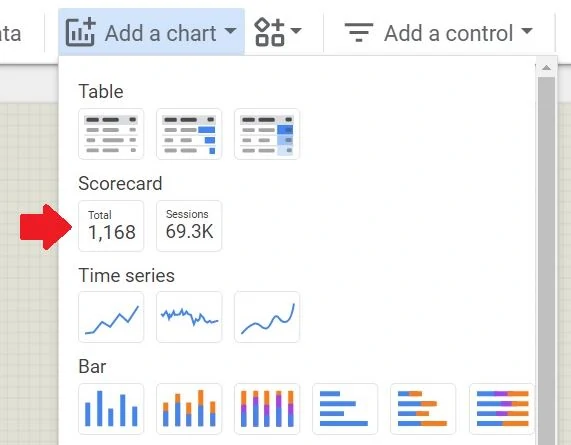
9 – Click on Add a chart from the top. Click on the first Scorecard and drag it onto the canvas.
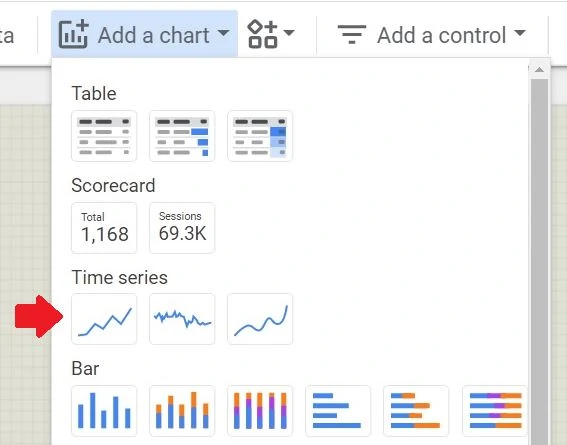
10 – Click on Add a chart from the top. Click on the first Time series and drag it onto the canvas.
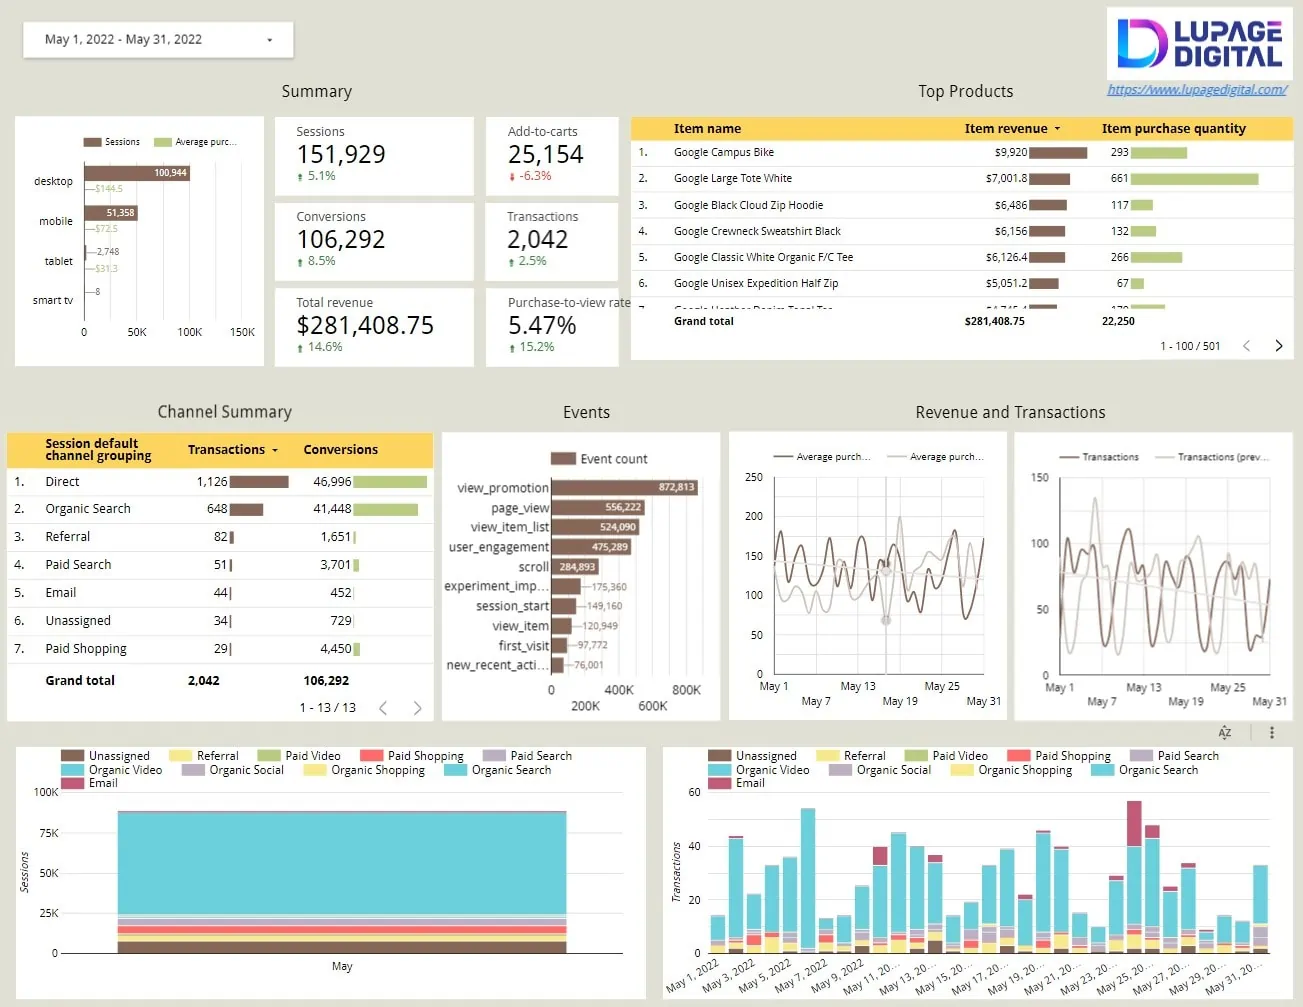
You would see something like this…
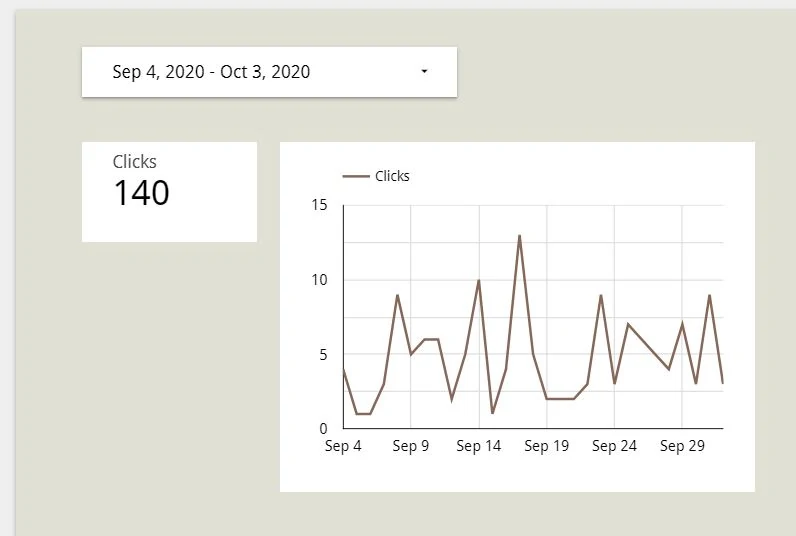
At this point, you now have a solid foundation for adding data to the dashboard. You can add other dimensions and metrics from Google Analytics 4. Design your GA4 dashboard further by using the navigation on the right.
Option 2: Third-Party Connector (Paid)
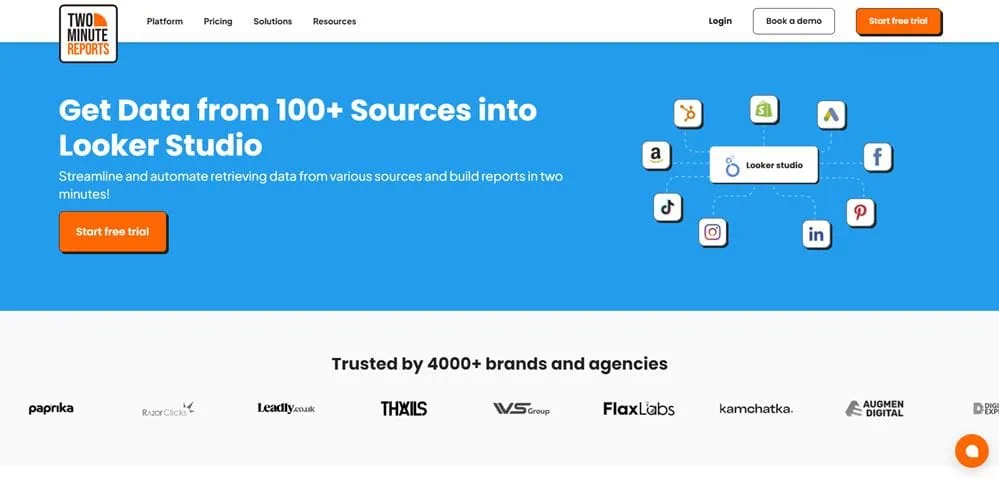
The second option to import GA4 data to Looker Studio is to use a paid third-party connector. It’s free and is enough to start building dashboards. You’ll use Two Minute Reports for this example. TMR imports data from the API directly to Looker Studio in minutes. Another connector to use is Supermetrics.
Create Data Source
1 – Go to Looker Studio.
2 – Click on + Create in the top left. Then click on Data source.
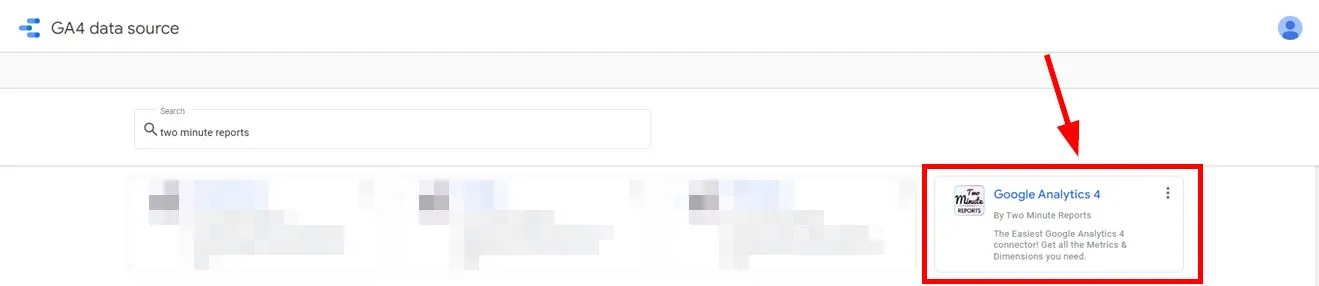
3 – Search for Two Minute Reports and look for the Google Analytics 4 connector.
4 – Once inside, click on the Authorize button if it appears. Then click on Allow. This authorizes email access.
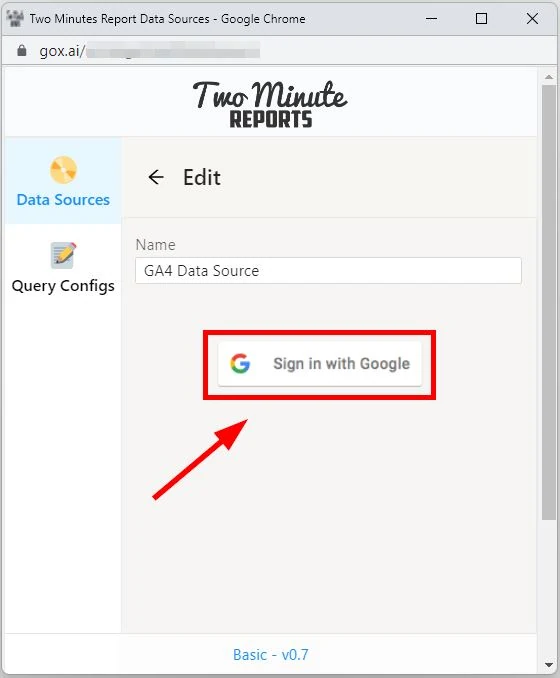
5 – After which, name your GA4 data source.
6 – Click on Sign in with Google. This authorizes the tool to acquire the GA4 accounts.
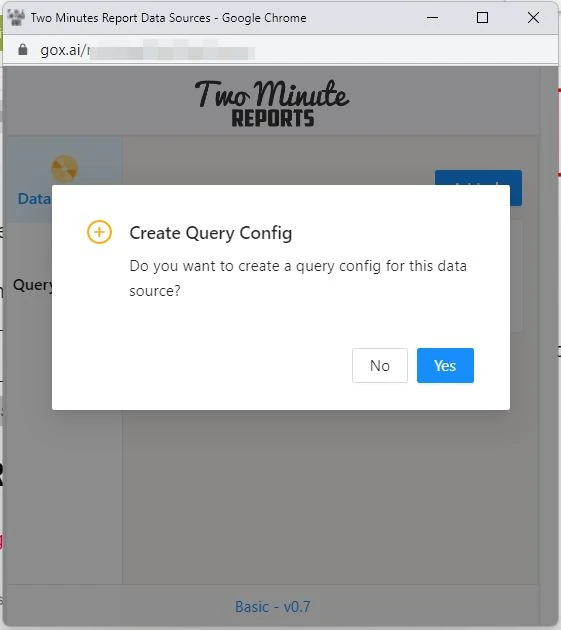
7 – Click on Yes to create a query config for this data source.
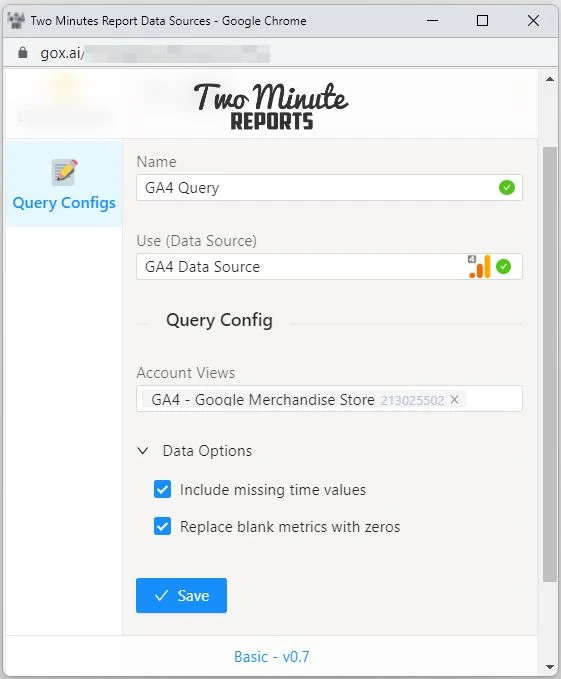
8 – Under Name, give your GA4 query a name.
9 – Under Use (Data Source), select the GA4 data source you named earlier.
10 – Under Account Views, select the GA4 property you’d like to get data from.
11 – Under Data Options, add checkmarks to Include missing time values and Replace blank metrics with zeros.
12 – Click on Save.
Then you’ll go back to the Looker Studio window as before.
13 – Under Select Query Config, select the GA4 query configuration you created earlier.
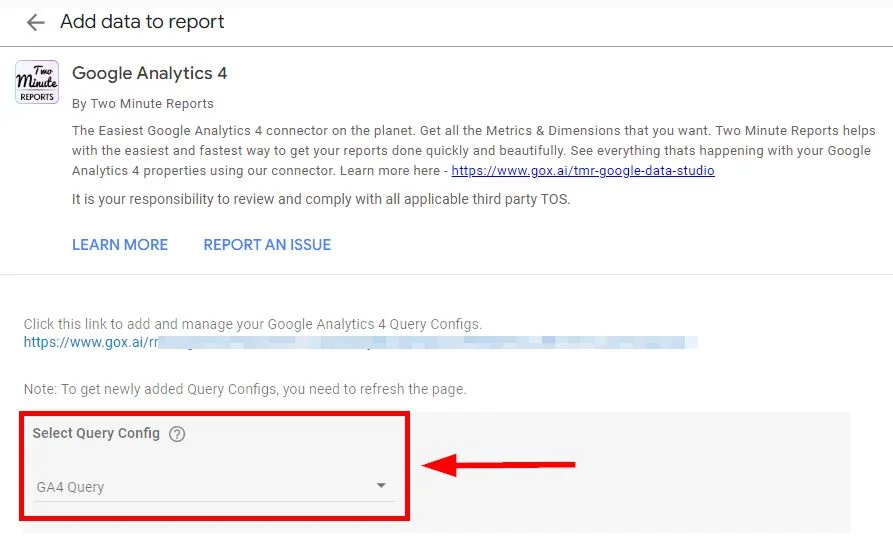
14 – Click on the blue Connect button on the upper right.
Viola! This data source is now saved to your LookerStudio workspace.
Create Report
1 – Go to Looker Studio.
2 – Click on + Create in the top left. Then click on Data source.
3- Once inside, click on My data sources in the navigation.
4 – Find and click on the Data source you added earlier.
5 – Click on the Add button on the bottom right.
6 – Click on the Add to Report button if it appears.
7 – Name your dashboard on the upper left.
8 – Click on Add a control from the top. Click on Date range control and drag it on the canvas.
9 – Click on Add a chart from the top. Click on the first Scorecard and drag it onto the canvas.
10 – Click on Add a chart from the top. Click on the first Time series and drag it onto the canvas.
You would see something like this…
At this point, you now have a solid foundation for adding data to the dashboard. You can add other dimensions and metrics from Google Analytics 4. Design your GA4 dashboard further by using the navigation on the right.
Designing a comprehensive dashboard requires dedication and time. It requires a deep understanding of Looker Studio. You may copy dashboard templates from other websites. How do you now copy a GA4 dashboard from another source?
How to Copy a GA4 Dashboard Template
Copy a dashboard template from another source if you don’t have the time to build your own dashboard. Here’s a template that you can copy:
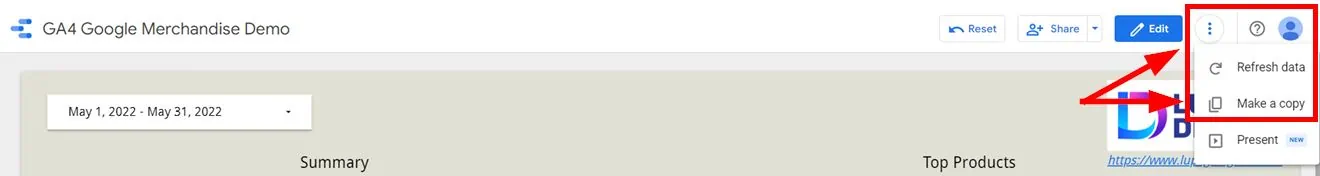
1 – Click on the three dots on the upper right. This is the More options button.
2 – Click on Make a copy.
3 – Under New Data Source, find the data source you created earlier.
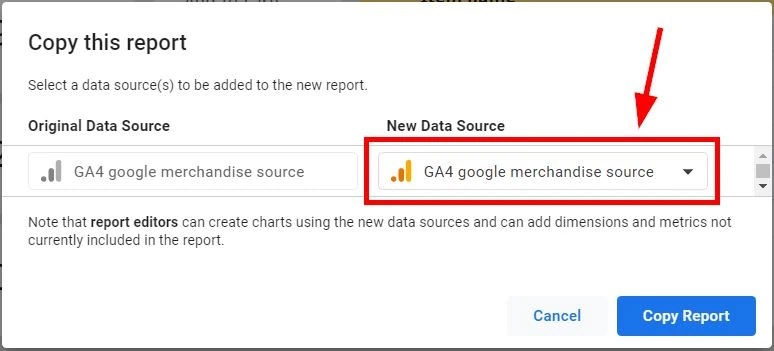
4 – Click on Copy Report.
Viola! At this point, the template shows your data from your GA4 property. After which, you can update and tweak for your specific needs.
Google Analytics 3 vs. Google Analytics 4 Data
Google Analytics 3 (or Universal Analytics) is not 100% the same as GA4.
Some of the dimensions and metrics from GA3 are not yet in GA4. In Looker Studio, you still need to manually create a 1:1 translation of GA3 data to GA4. The table below shows the data differences I’ve discovered so far. Since GA4 is still evolving, Google might add other data points in the future.
| GA3 (Universal Analytics) | GA4 (Google Analytics 4) |
|---|---|
| |
| |
| |
| |
| |
| |
The table above shows the appropriate formula on the GA4 side to acquire the same GA3 data. Edit the data source you imported and add a new calculated field.
How To Add a New Calculated Field
Calculated fields allow you to create new dimensions and metrics from your existing data points. It helps you extend the current information you have so that you can build more custom reports. Conversion rate is an example of a calculated metric–“Conversions divided by Sessions” (ConversionsSessions
1 – Go to your Data Source.
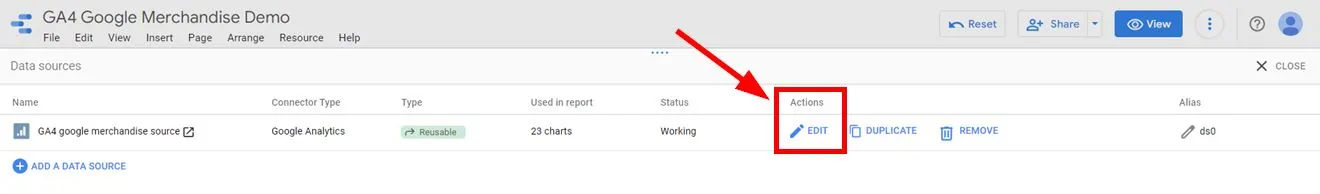
2 – Click on Add a Field.
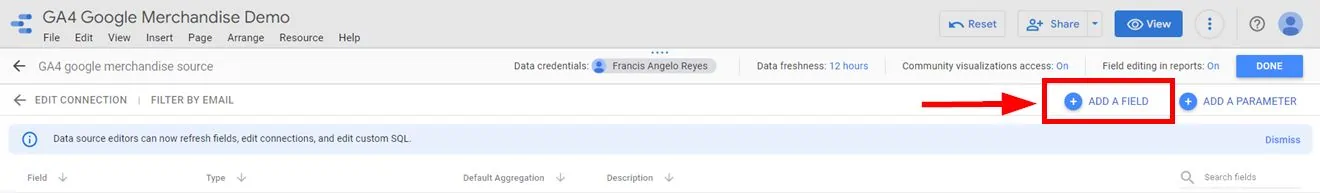
3 – Give the new Field a name on the upper left. This is important so that you can find this new Field in the future.
4 – Add the formula in the field. In this example, it’s ConversionsSessions
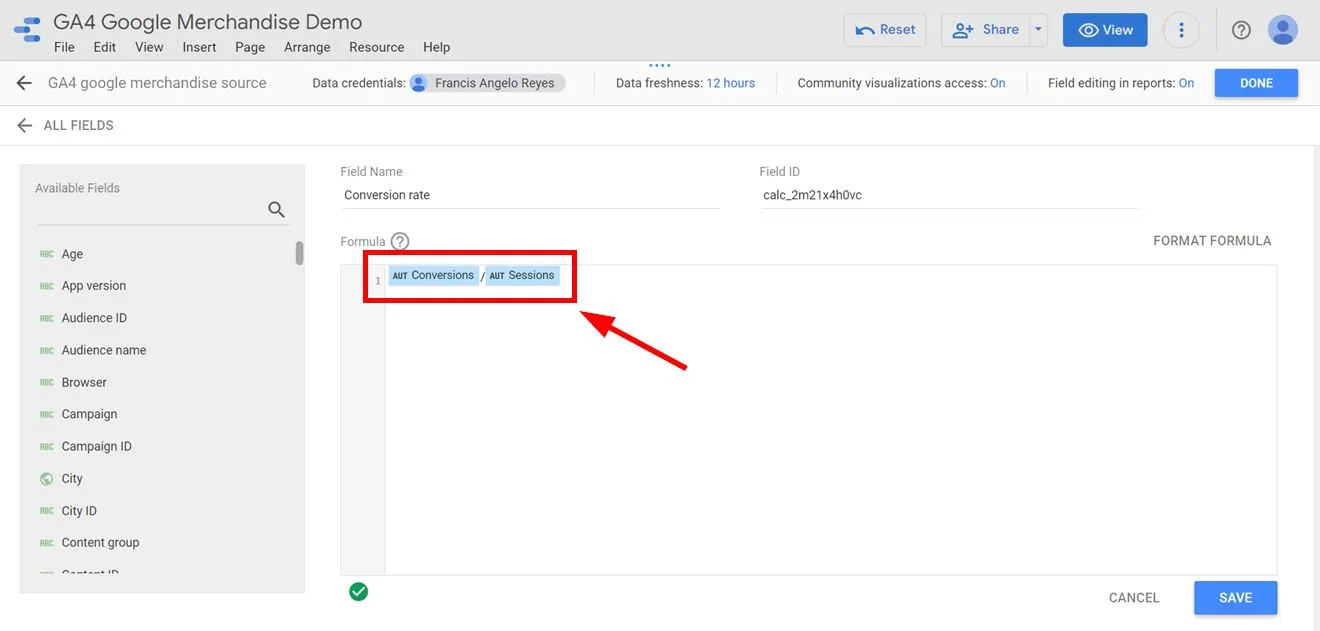
5 – Click on Save on the lower right.
Viola! Conversion rate is now added to the GA4 data source and you can now add this new metric to your GA4 reports. The steps above are important for automating reports. With the steps above, you avoid adding the same new calculated field for every dashboard you create. Once the steps are done, they are re-usable to every dashboard in the future.
More articles on automation:
Import Facebook Page Insights to Google Sheets
Import LinkedIn Page post data to Google Sheets
Import LinkedIn Ads API data to Google Sheets
Import Search Console Data to Google Sheets
Import WooCommerce data to Google Sheets
Import Facebook Ads data to Google Sheets
Import Google Ads data to Google Sheets
Import Mailchimp data To Google Sheets
Import Shopify data to Google Sheets
Import TikTok ads to Google Sheets
Import GA4 data to Google Sheets
Import ChatGPT to Google Sheets
Import JSON to Google Sheets
Export Gmail to Google Sheets
Conclusion: Create GA4 Reports in Looker Studio
These are the options to connect data from GA4 to Looker Studio. These methods (more in the future) allow API integrations between tools. Some connectors cost money, but the benefits outweigh more.
Avoid import and export spreadsheet hell. Maintain everything step-by-step in Looker Studio with tools if needed. Stop wasting time on repetitive tasks and start focusing on important things that impact the business. Hire a web analyst to help you.