
Interpreting Google Analytics data is tough. There are many data that marketers should understand to make decisions on businesses. Analysts need to look at Google Analytics data better. Then provide insights to optimize a campaign or a landing page based on the metrics.
When meeting with investors, they always ask for those reports through Google Analytics dashboards. It’s important to explain the data as accurately as possible to know where the company is headed. What does the data mean? Where are the customers in the funnel?
So, is there a better way in understanding Google Analytics reports better?
Interpret Google Analytics Data
There are two sides to every story. Metrics like bounce rates, page views, conversion rates are misunderstood. This happens when there’s no context behind them. Bounce rate is an example of this. Most people conclude that a high bounce rate is bad. But it’s also not.
A low metric is neither good nor bad. A high metric is also neither good nor bad. Data is how the analyst interprets the data. Most times going through these reports is confusing.
Below are scenarios on how to explain when Google Analytics metrics are either low or high. The left side is when the number is low and the right is when the number is high. And below those are a short point analysis.
Note that this is for Google Analytics 3 (Universal Analytics), not Google Analytics 4.
Embed this infographic to your website
| HTML Code |
|---|
<a href="https://www.lupagedigital.com/blog/interpret-google-analytics-data/" target="_blank"><img src="https://www.lupagedigital.com/wp-content/uploads/2021/01/interpret-ga-infographic.webp" alt="how to interpret google analytics data"></a> |
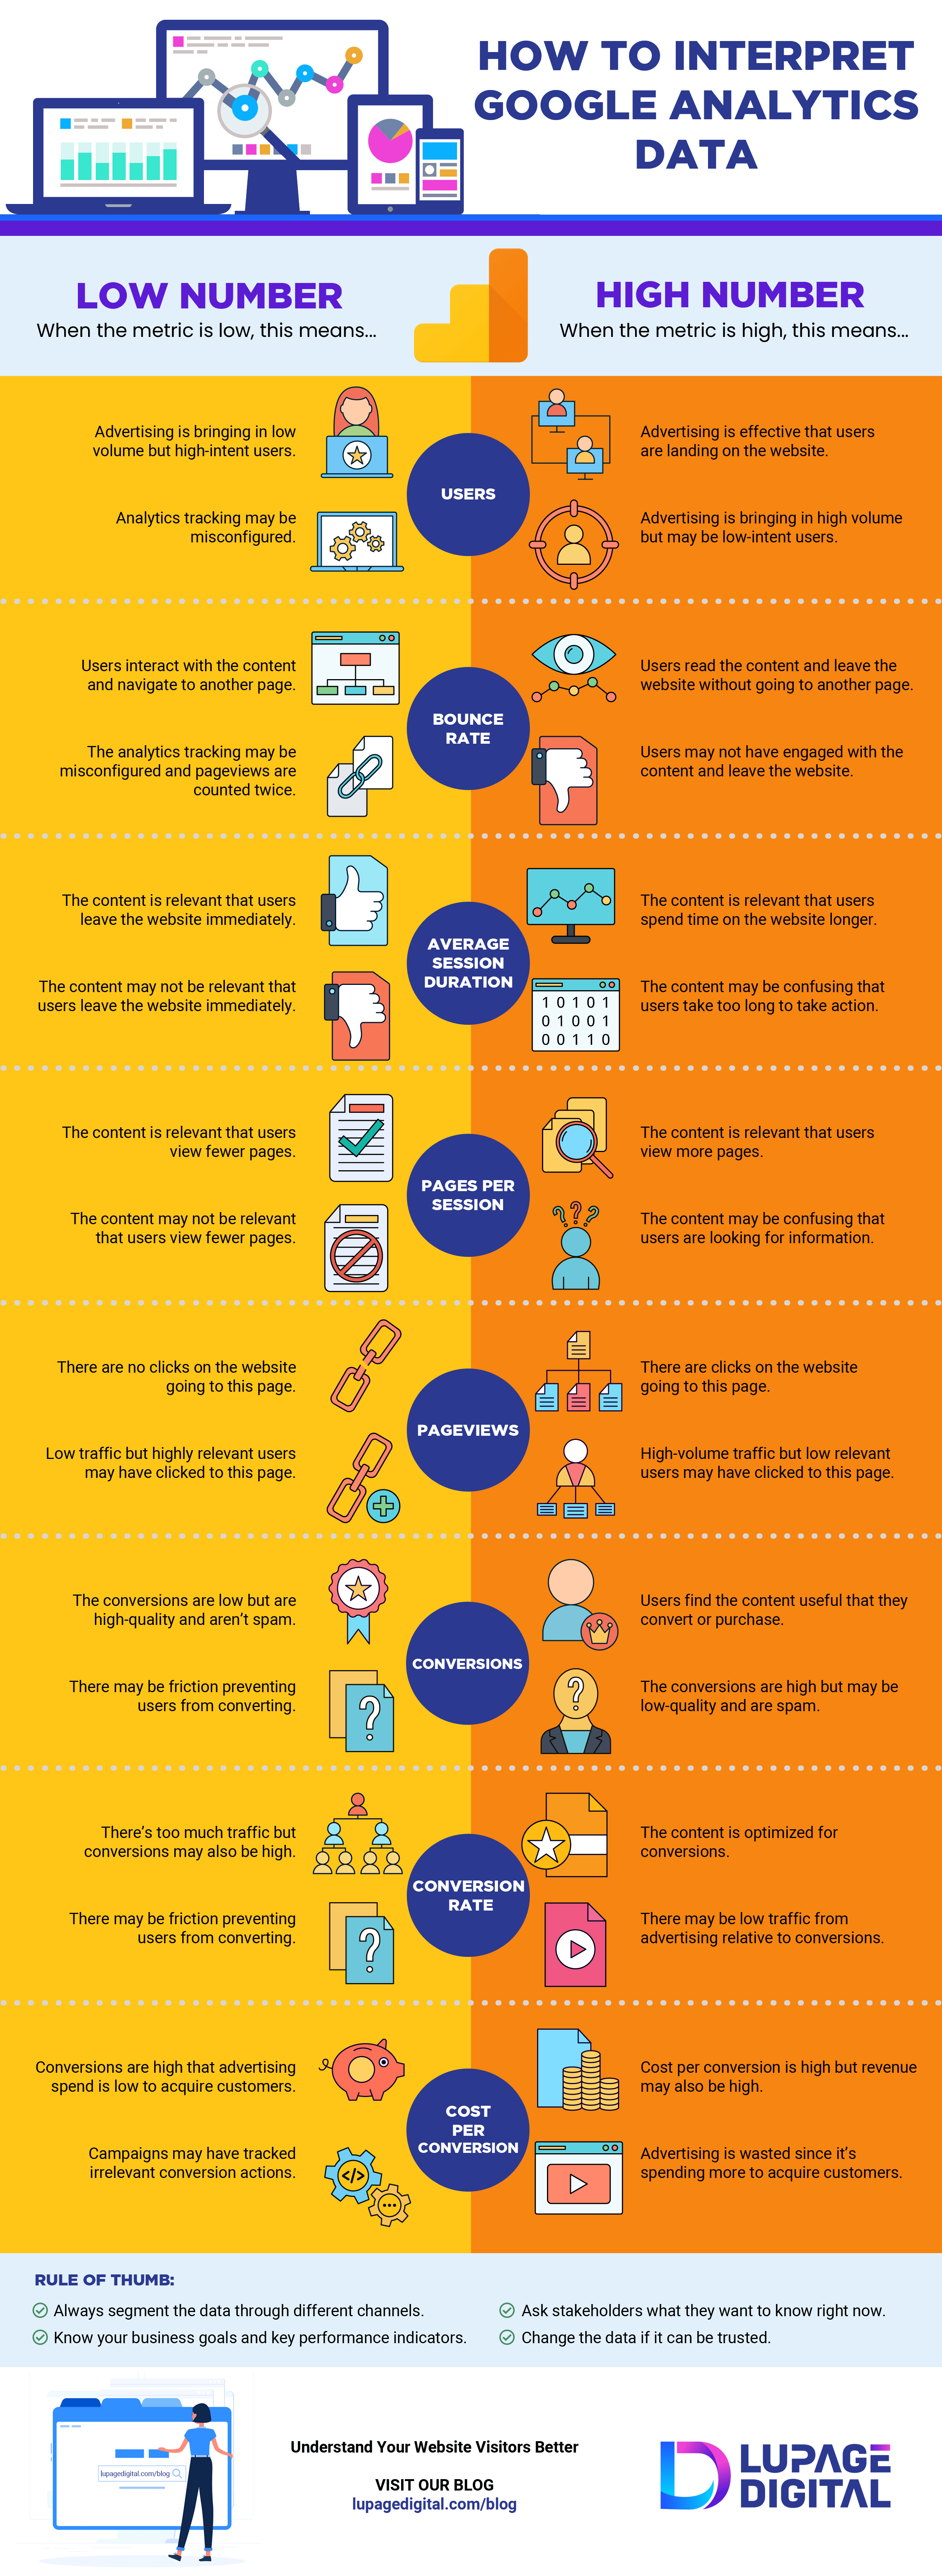
Users
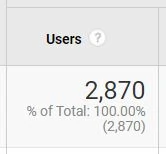
Low:
-Advertising is bringing in low volume but high-intent users.
-Analytics tracking may be misconfigured.
High:
-Advertising is effective that users are landing on the website.
-Advertising is bringing in high volume but may be low-intent users.
Bounce Rate
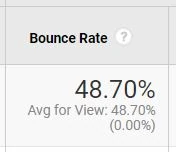
Low:
-Users interact with the content and navigate to another page.
-The analytics tracking may be misconfigured and pageviews are counted twice.
High:
-Users read the content and leave the website without going to another page.
-Users may not have engaged with the content and leave the website.
Average Session Duration
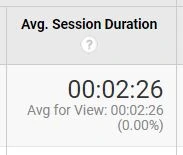
Low:
-The content is relevant that users leave the website immediately.
-The content may not be relevant that users leave the website immediately.
High:
-The content is relevant that users spend time on the website longer.
-The content may be confusing that users take too long to take action.
Pages Per Session
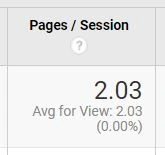
Low:
-The content is relevant that users view fewer pages.
-The content may not be relevant that users view fewer pages.
High:
-The content is relevant that users view more pages.
-The content may be confusing that users are looking for information.
Pageviews
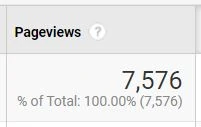
Low:
-There are no clicks on the website going to this page.
-Low traffic but highly relevant users may have clicked to this page.
High:
-There are clicks on the website going to this page.
-High-volume traffic but low relevant users may have clicked to this page.
Conversions (or Goal Completions)
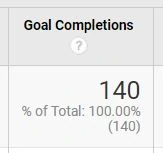
Low:
-The conversions are low but are high-quality and aren’t spam.
-There may be friction preventing users from converting.
High:
-Users find the content useful that they convert or purchase.
-The conversions are high but may be low-quality and are spam.
Conversion Rate
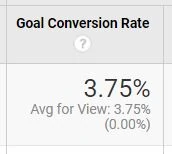
Low:
-There’s too much traffic but conversions may also be high.
-There may be friction preventing users from converting.
High:
-The content is optimized for conversions.
-There may be low traffic from advertising relative to conversions.
Cost Per Conversion
Low:
-Conversions are high that advertising spend is low to acquire customers.
-Campaigns may have tracked irrelevant conversion actions.
High:
-Cost per conversion is high but revenue may also be high.
-Advertising is wasted since it’s spending more to acquire customers.
Rule of Thumb
-Always segment the data through different channels.
-Know your business goals and key performance indicators.
-Ask stakeholders what they want to know right now.
-Check the data if it can be trusted.
-Check the date range to have more precise data.
Conclusion: Interpret Google Analytics Reports Better
It’s a little confusing to understand Google Analytics data. It takes more than a single day of training to learn how to analyze them. This infographic helps analysts identify trends. I also suggest to create report templates to help you understand the data points.
In the past, it was hard for analysts to understand what they were looking at. Now their understanding isn’t all over the place and the analysis means something. See missing key insights to understand website visitors better.