
Funnels are not straightforward in Google Analytics. It’s not a named metric that you find. One might think that it’s as simple as one click to “tell everything”, but Google Analytics is more than meets the eye.
Many definitions come to mind of what a funnel is. Awareness, Consideration, Conversion; or Acquisition, Activation, Retention. It might just be product views, add to cart, checkout, and then purchase for e-commerce.
This guide shows where to get that funnel data. Stakeholders, digital marketers, and web analysts need common ground on what data to interpret is to inform business decisions.
5 Google Analytics Funnels
There are different ways to show “funnels” in Google Analytics. These reports are:
- Funnel Visualization
- Goal Flow
- Product Performance Report
- Shopping Behavior Report
- Checkout Behavior Report
These reports showcases important data points. It’s a matter of digging into the tool and do minor implementation to populate the data.
Funnel Visualization
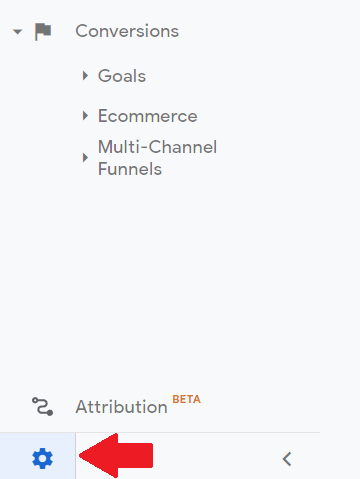
Go to Conversions > Goals > Funnel Visualization.
The funnel looks like this:
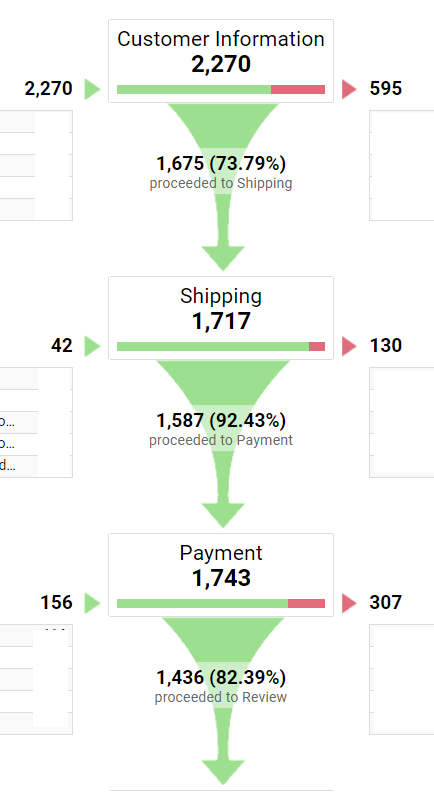
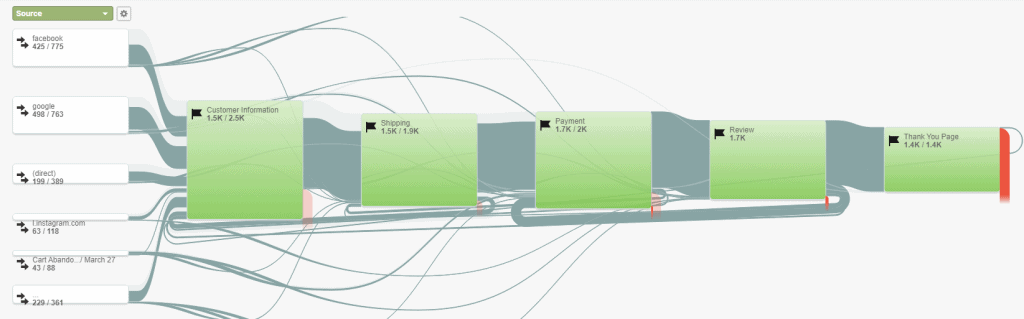
The report visualizes the checkout steps. It doesn’t report the entire user journey but it still gives useful data. It tracks checkout steps pageview automatically.
Destination goals should exist first in Google Analytics for funnel visualization setup. There’s a guide near the end to know how to set up destination goals.
The metrics are useful since you see the drop-offs per page. It also reports the exits and the pages where the user landed on next in the checkout process. Then it trickles down to the remaining steps.
In this example, you see the number of pageviews on the Customer Information page. 73.79% went from Customer Information to the Shipping page. It also displays the next pages and exits the user takes.
Goal Glow
Go to Conversions > Goals > Goal Flow.
The funnel looks like this:
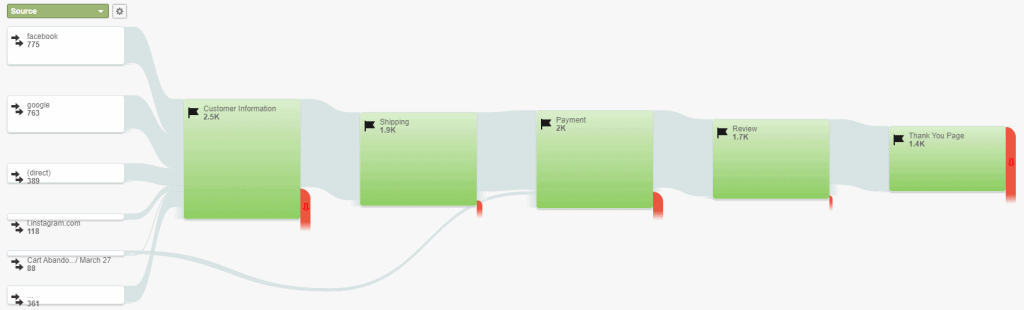
The goal flow displays a funnel similar to funnel visualization. The goal flow report follows the user path on pages set in the Destination goals.
The key difference between funnel visualization and goal flow is that the goal flow gives loops of what users take. A user might drop from the shipping page on a day and might come back to it after. The goal flow report shows while funnel visualization is a rigid funnel.
Using both reports leads to good insights. There’s an opportunity for optimization when a page has a higher exit rate than the other page. Every stage of the checkout steps provides specific friction.
A shipping page might have a higher drop-off point because the website is asking too much information from the users. Or the payments page has a higher drop-off because their preferred payment is not supported. Or contact information page has a higher drop-off because there’s no guest checkout.
Product Performance Report
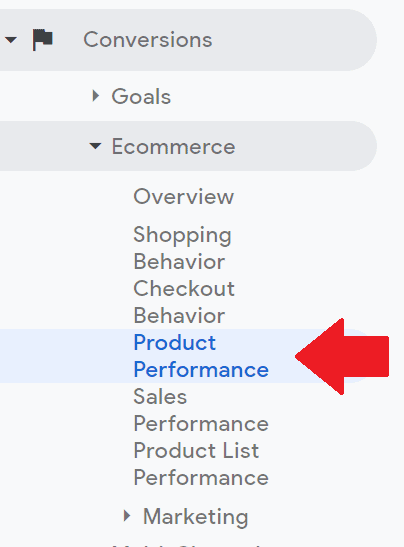
Go to Conversions > E-commerce > Product Performance.
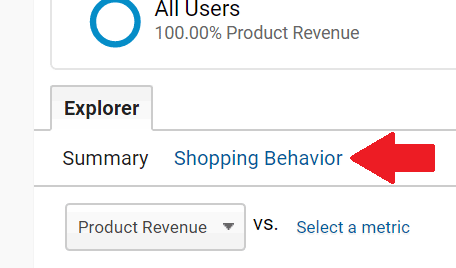
Then click Shopping Behavior.
The report looks something like this:
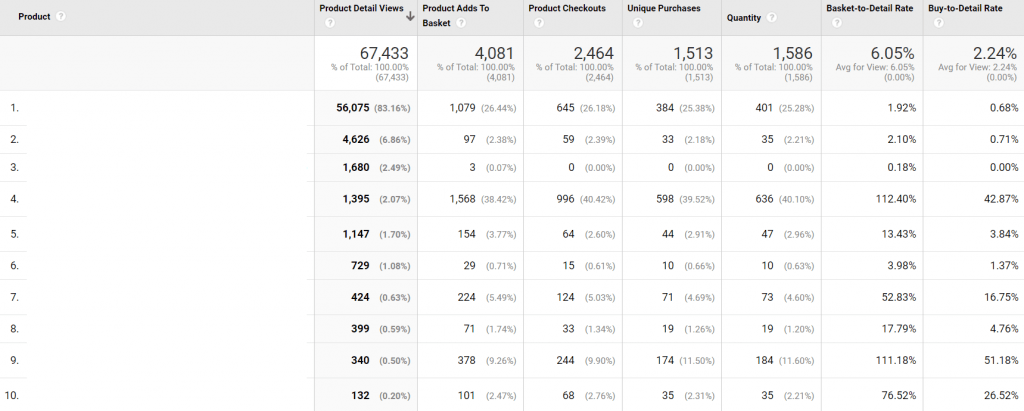
Another great way to visualize a funnel in Google Analytics is the product performance report. Product performance reports on the products and the actions that users engaged in.
NOTE: Enhanced E-commerce reporting should be enabled and the data should be pushed into Google Analytics or Google Tag Manager for the metrics to populate. Unfortunately, enhanced e-commerce implementation is not covered in this post. Ask your web developers or engineers about it.
The metrics of this report are:

| Metric | Description |
|---|---|
| Product Detail Views | The number of times a user viewed a product. |
| Product Add To Cart | The number of times a user added that product. |
| Product Checkouts | The number of times a user proceeded to checkout with that product. |
| Unique Purchases | The number of times this product was purchased and was part of a transaction. |
| Quantity | The number of items the product was bought for. |
| Cart-to-Detail Rate | The ratio from viewing the product to add to cart. Product Add To Cart divide by Product Detail Views. |
| Buy-to-Detail Rate | The ratio from viewing the product to purchase. Unique Purchases divide by Product Detail Views. |
This report lists all products of the e-commerce website. It gains insights into how each product is contributing to the businesses.
The same data is applied to the product category and product brand when implemented correctly. See add-to-cart numbers on the product category or buy-to-detail rate on the product brand.
Shopping Behavior Report
Go To Conversions > E-commerce > Shopping Behavior.
The funnel looks like this:
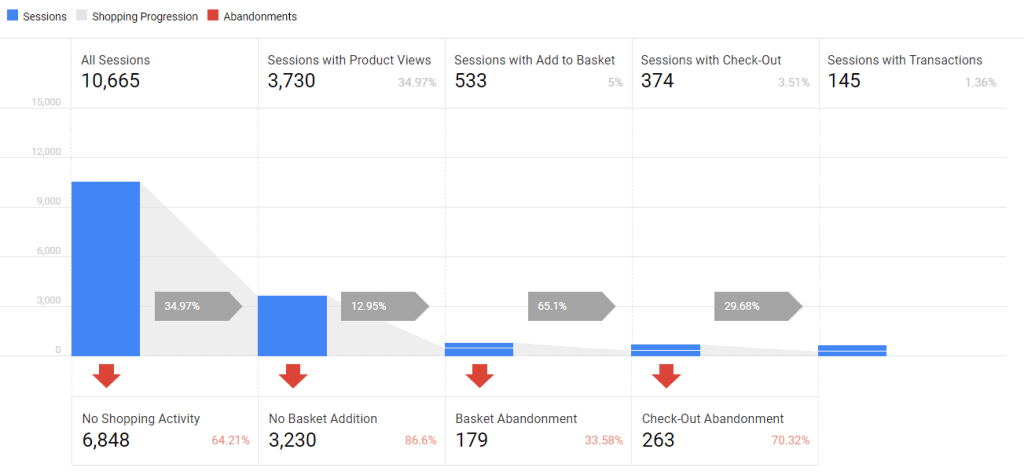
Shopping Behavior populates once Enhanced Ecommerce is enabled. The data is pushed in the backend so Google Analytics captures them like the Product Performance report.
Shopping Behavior reports is similar to Product Performance. The difference is that the Shopping Behavior report is on a session-level scope while Product Performance is hit-level scope.
These are the metrics of the Shopping Behavior report:

| Metric | Description |
|---|---|
| All Sessions | This represents all visits. |
| Sessions with Product Views | These are visits with product-level views. |
| Sessions with Add To Cart | These are visits with add to cart of any product. |
| Sessions with Checkout | These are visits that proceed with a check-out of any product. |
| Sessions with Transactions | These are visits that had an order. |
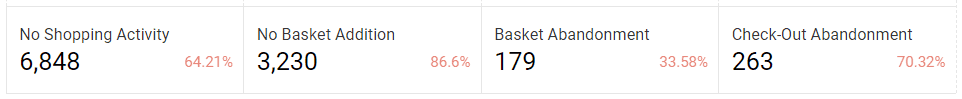
The Shopping Behavior report also has “abandonment” and “no activity” metrics. These are the drop-offs of the metrics above.
| Metric | Description |
|---|---|
| No Shopping Activity | This is total visits with no shopping activity at all. This means no product view, add to cart, checkout, and orders. |
| No Add To Cart | These are visits with no add to cart of any product. |
| Cart Abandonment | These are visits that added to the cart and abandoned soon after. |
| Check-out Abandonment | These are visits that proceed to the checkout process and abandoned soon after. |
In this example, there’s a massive drop-off from “All Visits” to “Sessions with Product Views”. Only 34.97% of all visits viewed a product. This is 64.21% of no shopping activity. The product offer may not be good enough for the customer.
Shopping Behavior is insightful to any stakeholder. It gives a great bird’s-eye view of the shopping experience from landing on the website until purchase.
What makes this report powerful is you can segment this report as well. Segment by device, user type, location, audiences, product, product category, or product brand to have deeper insights.
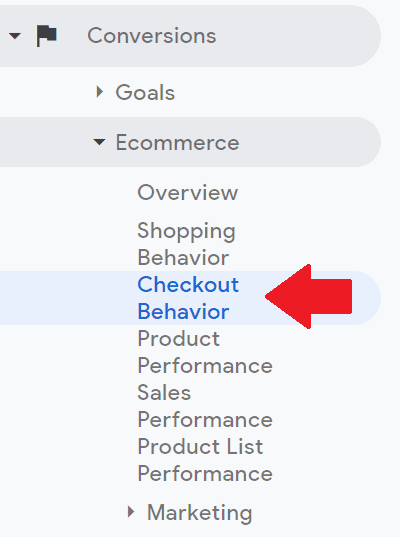
Checkout Behavior Report
Go To Conversions > E-commerce > Checkout Behavior.
The funnel looks like this:
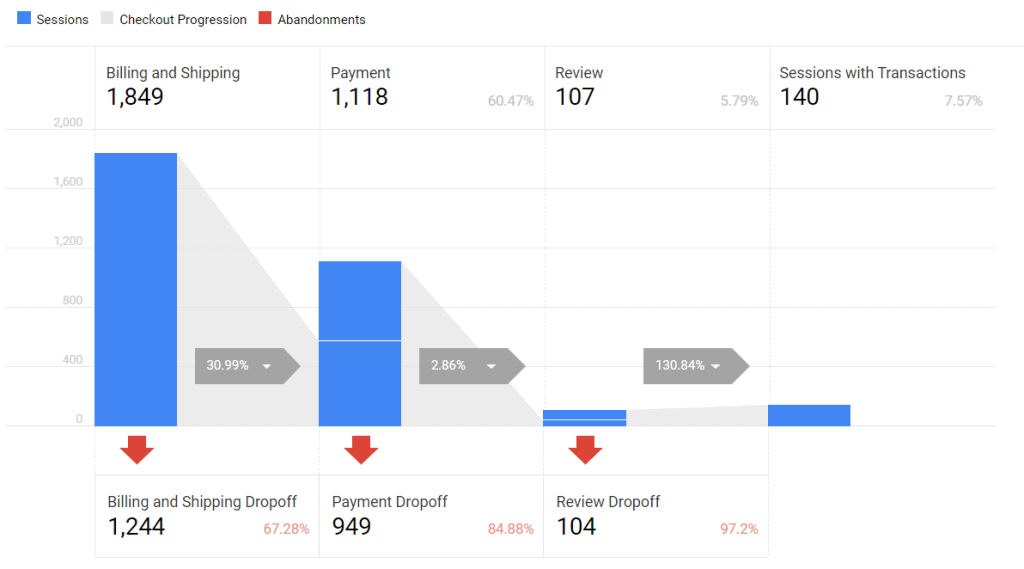
The last report for Google Analytics funnels is the Checkout Behavior report. This is also another important report you can learn about funnels in Google Analytics.
Checkout Behavior is similar to Shopping Behavior. The difference is Checkout Behavior give metrics on the checkout steps while Shopping Behavior gives metrics on the overall shopping journey. This report also gives follow-throughs and the drop-offs.
In this example, there’s a massive drop-off from “Billing and Shipping” to “Sessions with Product Views”. Only 30.99% of visits went billing and shipping.
This means 67.28% dropped from the billing and shipping page. The page might be asking too much information from the customer or there’s no guest checkout.
Set Up Destination Goal for Funnel Visualization and Goal Flow
1- Click Admin.
2 – Click Goals.
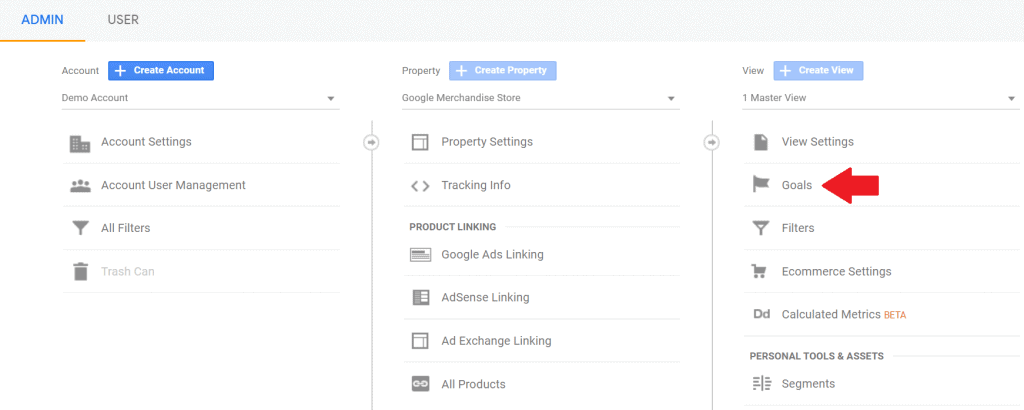
3 – Click +NEW GOAL button.
This is where you create destination goals for funnel visualization and goal flow.
4 – Under Template, scroll down and click “Custom”. Ignore the rest of the fields (Revenue, Acquisition, Inquiry, etc) since they’re not needed.
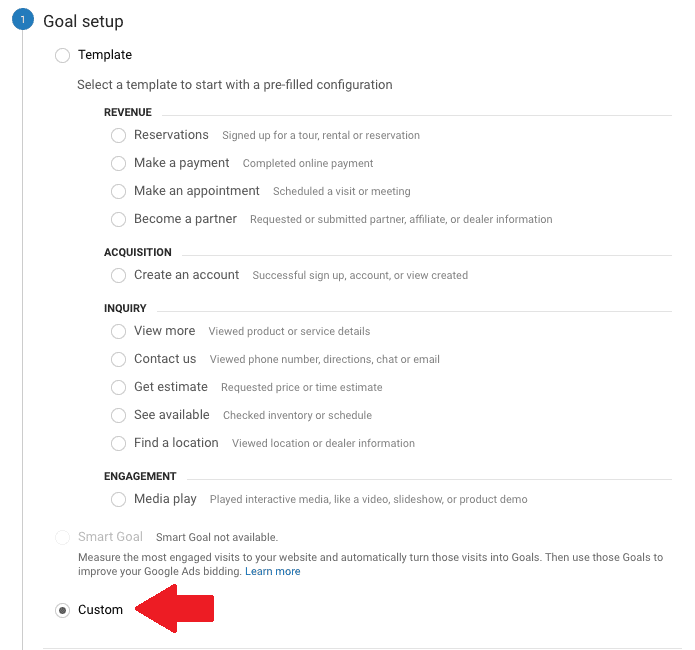
5 – Click Continue.
You’re now under Goal description.
6 – Name the Goal.
7 – Goal slot ID doesn’t matter since it’s the default depending on how many goals in the account.
8 – Under Type, click “Destination”. This is important.
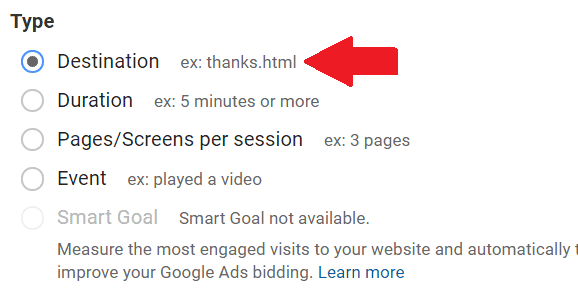
9 – Click Continue.
You’re now under Goal details.
10 – Change Destination to “Regular expression”.
11 – Turn on “Funnel”.
12 – Click “+Add another Step”. Add the number of checkout steps your website has.
13 – Click “Required?” to yes.
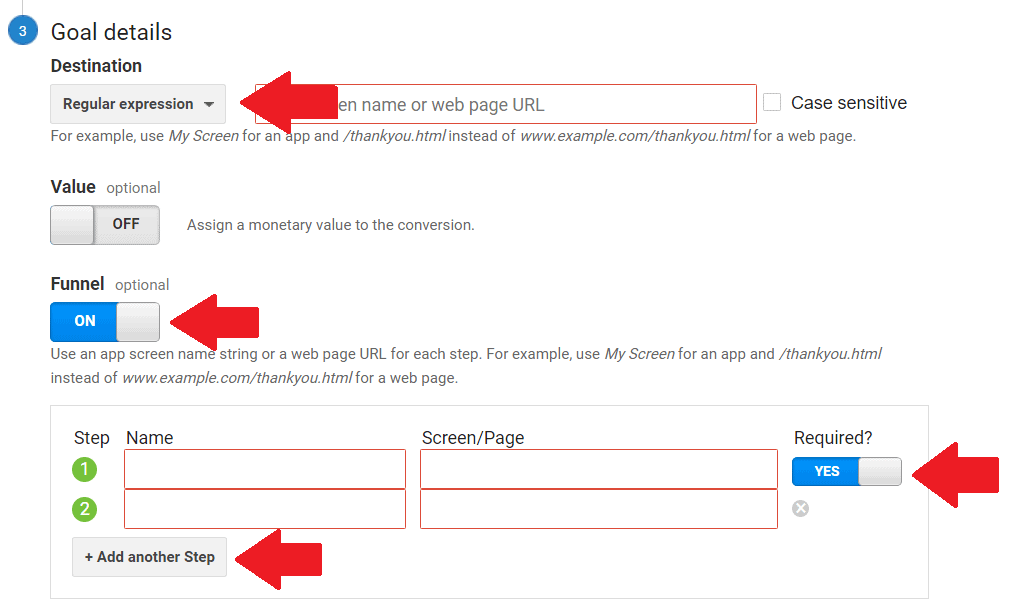
This is where things get tricky because of regular expressions…
Use Regular Expressions
Learn Regular Expressions (regex) to proceed. Regex is “pattern matching” that matches whatever alphabet or number you add in a field.
There are many resources on the Internet to master regex but these are the important ones for Destination Goals:
- Carat ^ -> This means “starts with”.
- Parenthesis () -> This is a container.
- and dot asterisk .* – >This means “capture all”.
You add the checkout flow URLs through regex matching. It looks something like this:
Destination: Order success ^(/order-success-page).*
Step 1: Cart ^(/cart-page).*
Step 2: Shipping ^(/shipping-page).*
Step 3: Payment ^(/payment-page).*
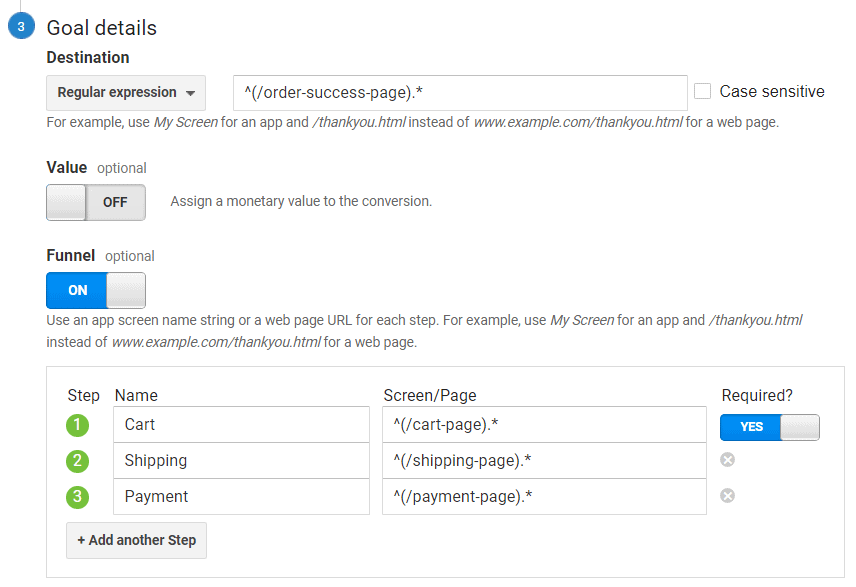
In this example, I added Cart, Shipping, and then Payment. This is very similar to Shopify E-commerce setup.
Make sure the order success page is not part of the steps because it’s the destination goal.
13 – Click Save. Whew!
Regex is written this way because it captures all possible pages that contain these page paths.
Checkout pages have a special URL structure. The shipping page might look like “/shipping/238789347” or the order success page might look like “/?variant=24787/?order-success”.
Find Your Checkout Pages
Here are the steps to find the checkout pages:
1- Go to All Pages report (Behavior > Site Content > All Pages).
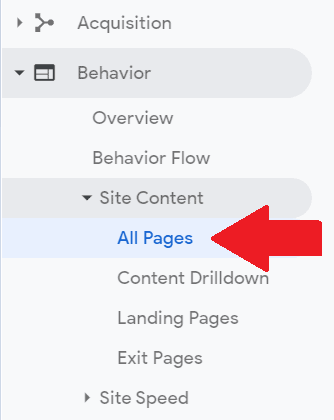
2 – Type “checkout” in the filter.

Note: This is different on your website. Find out what your cart page and checkout steps pages are. Ask help from a developer or google analytics consultant.
Wait for a few days when you gather transactions. When users purchase on your e-commerce site, they viewed the checkout pages (Cart, Shipping, and Payment) before landing on the order success page.
Google visualizes the drop-offs in the checkout pages through funnel visualization and goal flow reports.
Set Up Checkout Labelling for Checkout Behavior
1 – Click Admin.
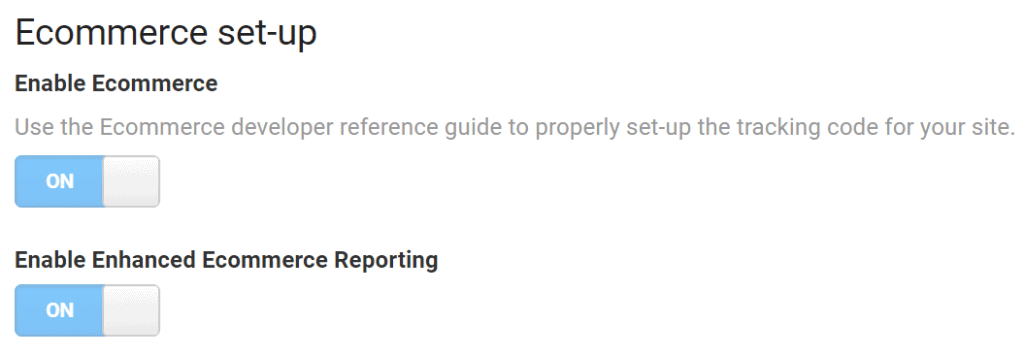
2 – Click “Ecommerce Settings”.
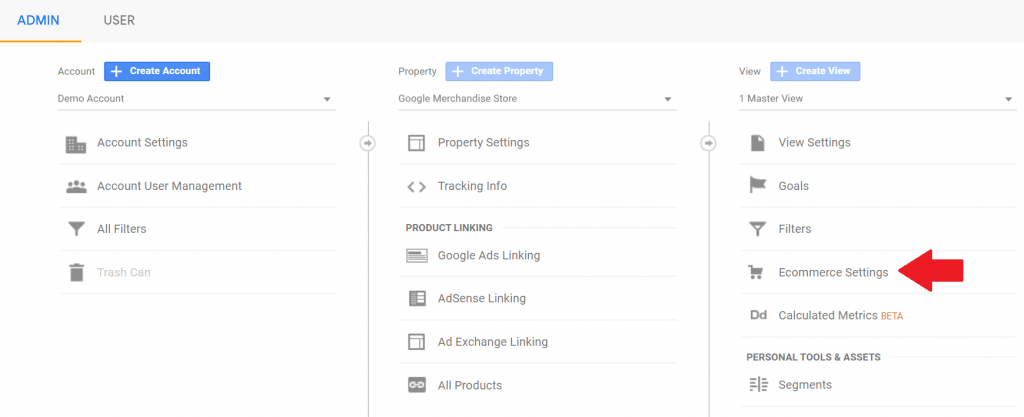
3 – Turn on Enhanced Ecommerce. Again, enhanced e-commerce implementation is needed for this to work.
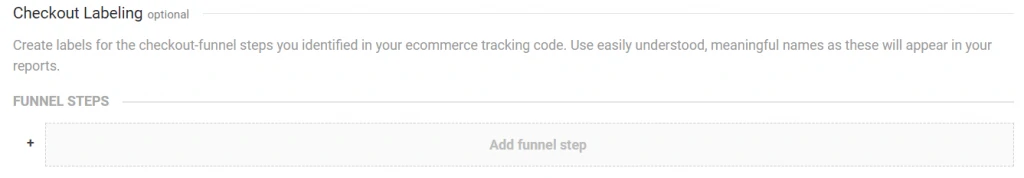
4 – Click “Add funnel step” under “Checkout Labeling”. This is depending on your E-commerce setup.
5 – Name the checkout steps based on the enhanced e-commerce tracking code that was implemented. Ask help from a web developer.
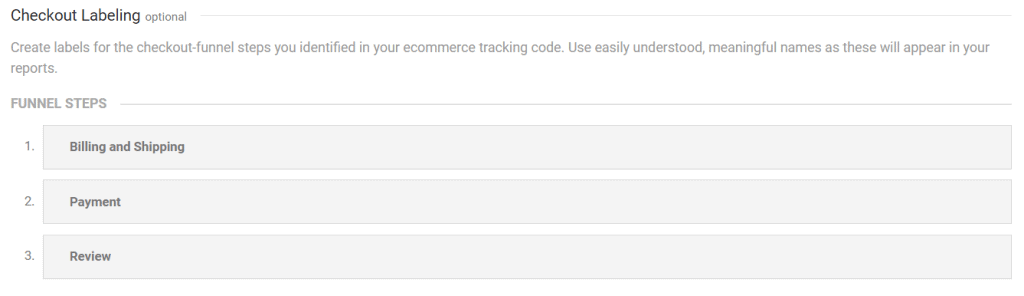
Wait for a couple of days until the data populates.
Conclusion: Understand Different Google Analytics Funnels Today
A Google Analytics funnel is not a straight line. Insights are not straightforward since it requires digging into GA. Web analysts go the extra mile to discover the funnels that are important to stakeholders.
Digital marketers might get a clear idea of what the funnel looks like for their business. Uncover amazing insights about users when you know where to look and how to look for them.