
How do you create a data visualization dashboard for SEO?
– SEO Analyst
Google announced they are rebranding Data Studio to Looker Studio.
An SEO dashboard in Looker Studio is important to any analyst and digital marketer. Websites get more than 50% of their traffic from SEO. There are trillions of searches on Google alone. So you can’t deny that measuring SEO performance and interpreting the data are critical.
SEO Dashboard Template
Looker Studio hastens the process and removes any manual work. This guide shows how to build an SEO dashboard template in GDS on your own. These templates range from a keywords report to organic search performance. Report templates are tough to do at the start. But once they’re built, they’re automated.
Create SEO Dashboards in Looker Studio
Sections:
1. Google Search Console Installation
2. Looker Studio
Have access to Google Search Console and Looker Studio to get much from this guide. Before doing an SEO dashboard in Looker Studio, install Google Search Console first. A Google account, whether a personal Gmail or G Suite, is needed.
Step 1: Google Search Console
Google Search Console is where you track website’s SEO performance. The SEO dashboard on Looker Studio needs this bit first.
Adding The Website Property
1 – Go to Google Search Console and log-in.
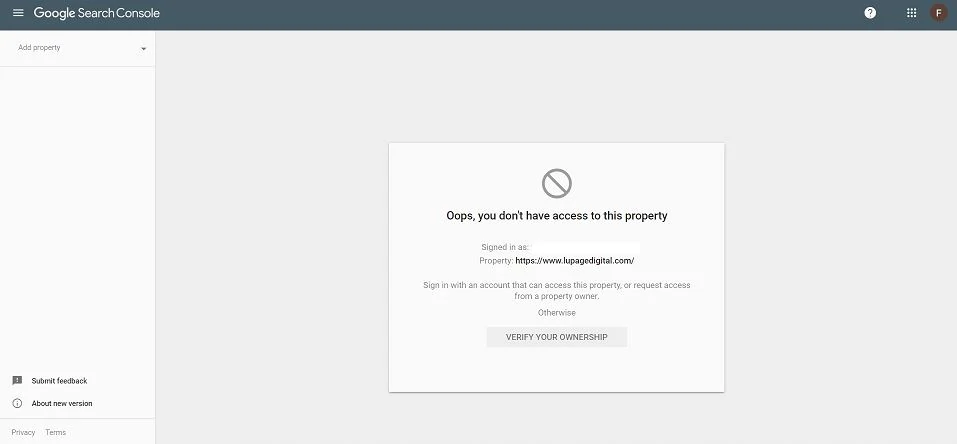
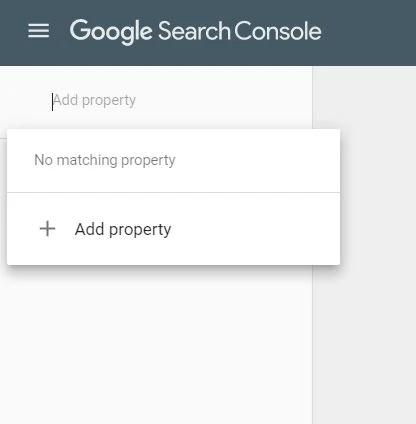
2 – Once inside, click Add property on the upper left.
3 – For simplicity, choose URL Prefix on the right. Enter the main domain. The URL should be a complete name.
Example: https://www.yourdomain.com.
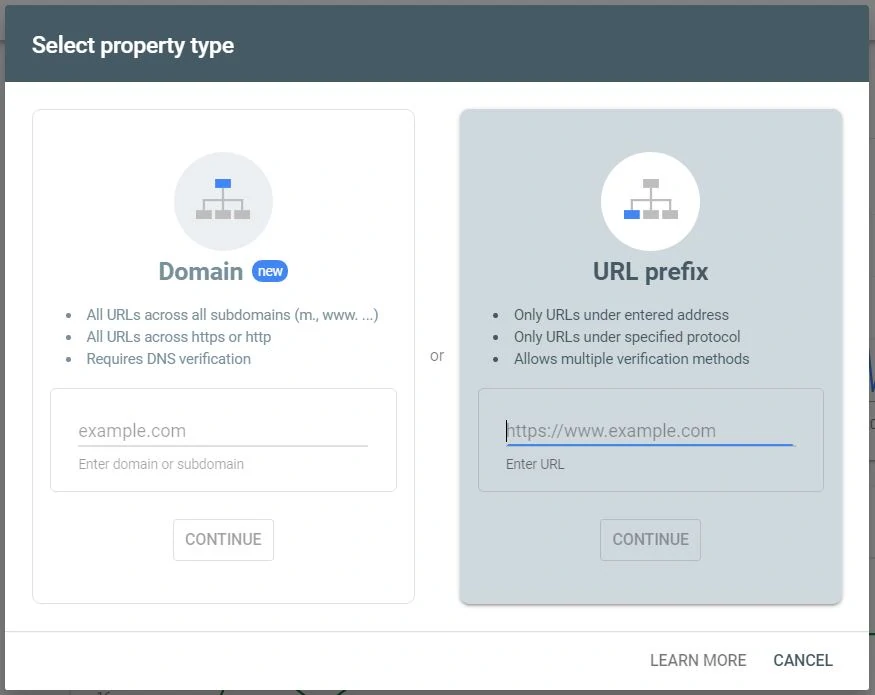
Note: https and www are added if this is part of the main domain. If the main domain is https://yourdomain.com (no www), then add that one instead. This is important in the data collection phase. Ask you SEO consultant or digital analyst for clarity.
4 – Next is you verify the property. There are two ways. Choose one.
a) via Google Analytics or
b) via Google Tag Manager
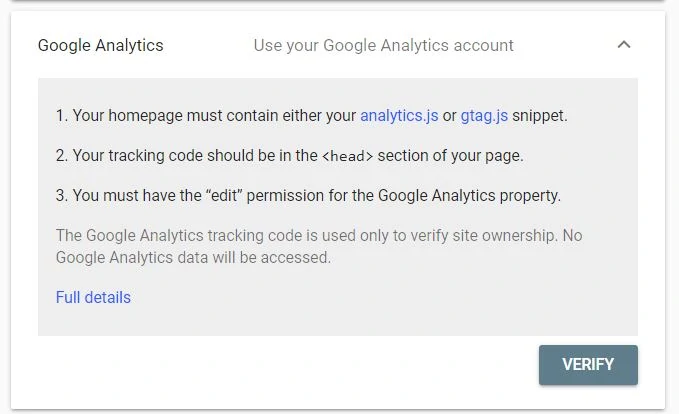
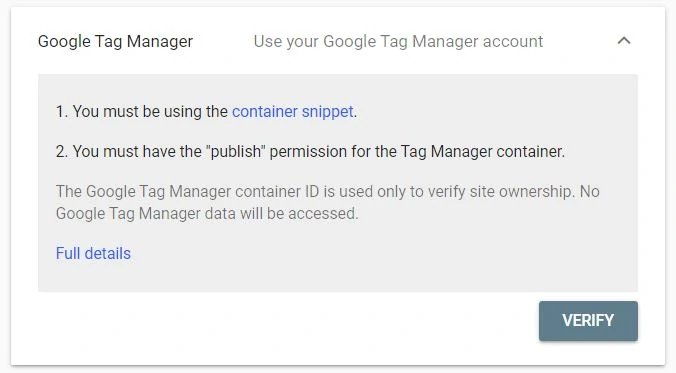
Choose Google Analytics and click Verify. If that doesn’t work, Choose Google Tag Manager and click Verify.
Note: You shouldn’t have a problem with verification if all conditions are met:
a – The email access to Google Search Console is the same email access to Google Analytics.
b – The email address has access to Google Analytics.
c – The Google Analytics or Google Tag Manager tracking code is already installed on the website.
Consult with an analyst if the verification doesn’t work. This shouldn’t be a problem since you have access to all data sources anyway. It’s a bigger issue if Google Analytics or Google Tag Manager isn’t installed yet. You can also export data from Google Search Console.
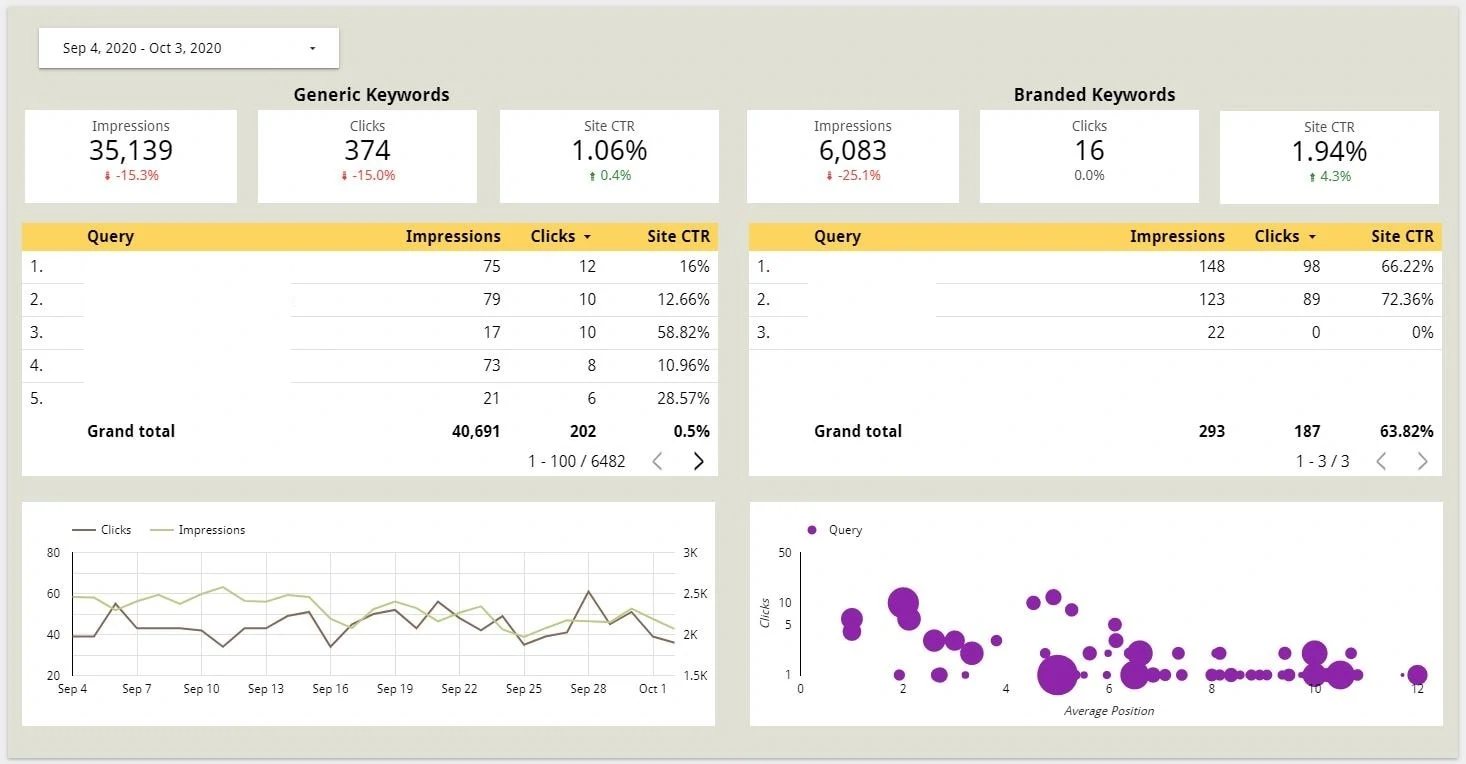
Let it gather data for a couple of days. Once you gather the data, you see something like this:
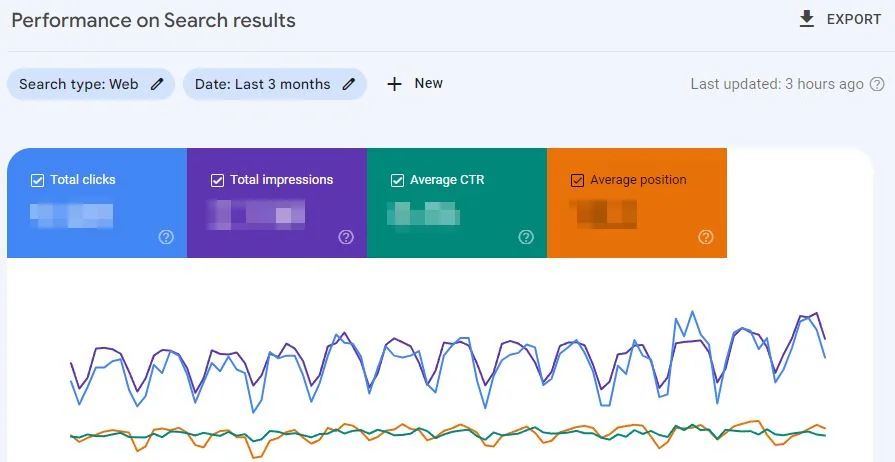
Understanding The Metrics
What do the metrics mean?
Total clicks – The number of clicks from the Google search results page going to the website.
Total impressions – The number of times the website appeared on the Google search results page.
Average click-through rate (CTR) – The average percentage of clicks from the impressions. Calculated as clicks divided by impressions (total clicks / total impressions).
Average position – The estimated ranking of the website for a specific SEO keyword.
The data gathered in Google Search Console is transferable to Looker Studio. You are done with Google Search Console.
Now to the next phase…
Step 2: Looker Studio
Looker Studio is a data visualization tool from Google. You use the metrics collected from Google Search Console.
Adding The Data Source
1 – Go to Looker Studio and log-in with the same email.
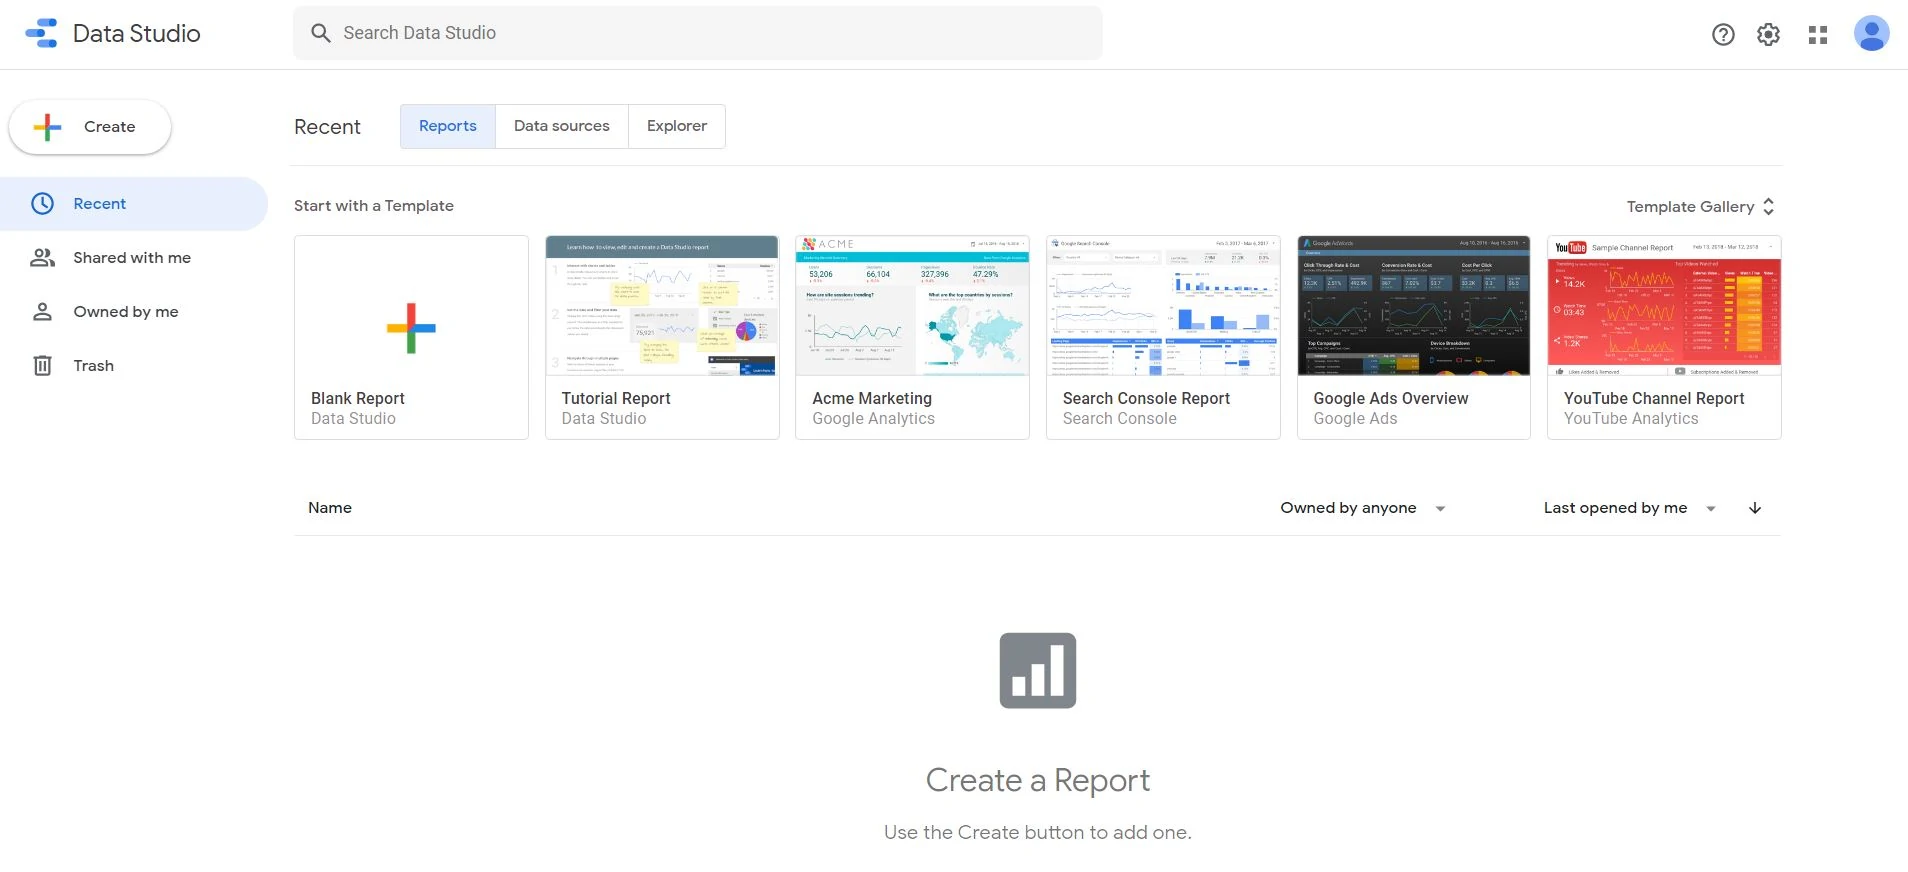
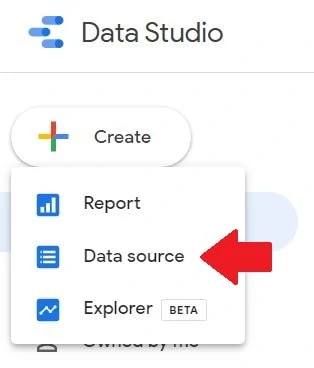
2 – Click Create from the top left. Then click Data source.
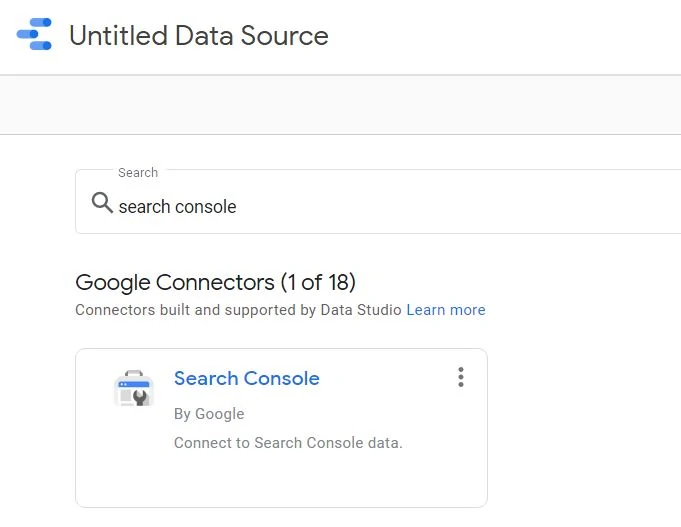
3 – Search for ‘search console’ and pick the official Search Console one. You can also pick third-party connectors like Two Minute Reports or Supermetrics.
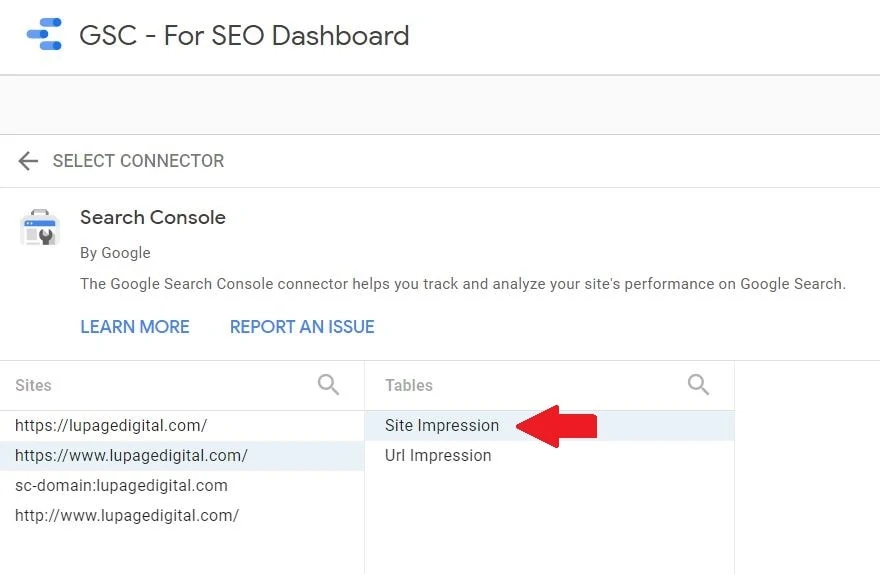
4 – Once inside, choose the domain you want data from. This is the same domain in the Google Search Console you added earlier.
5 – Choose Site impression under Tables. Choose web as Property Parameter if it’s there.
6 – Name the data source.
7 – Click the Connect or Add button on the right side. This adds the data source in the Looker Studio internal drive.
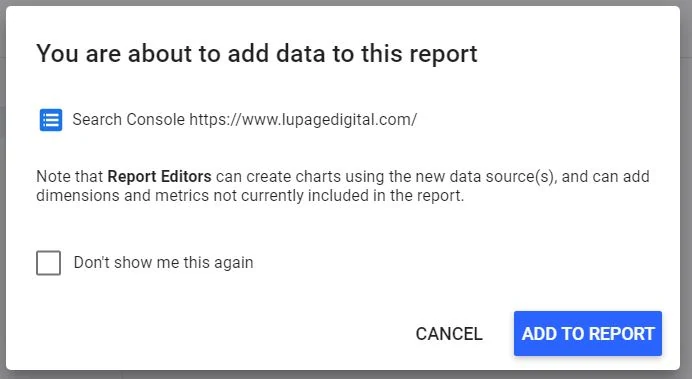
8 – Click Create Report. You should have a prompt Add to report in the end.
Adding The Metrics
You should now have an empty canvas for the dashboard. Now add metrics…
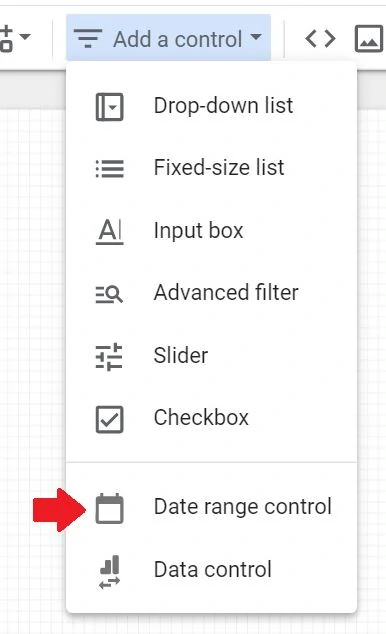
1 – Click Add a control from the top. Click Date range control and drag it on the canvas.
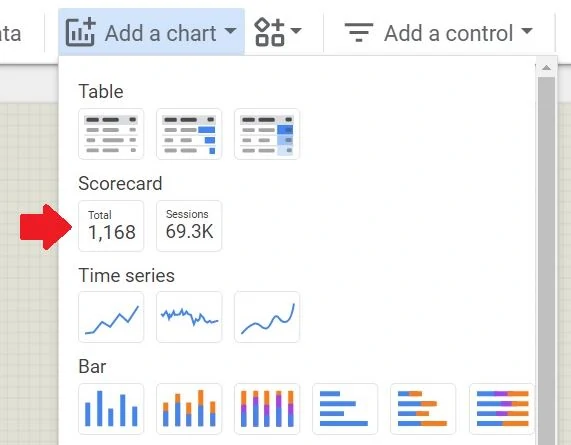
2 – Click Add a chart from the top. Click the first Scorecard and drag it on the canvas.
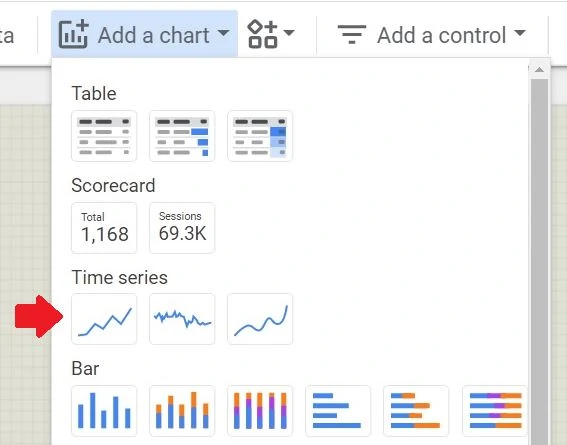
3 – Click Add a chart from the top. Click the first Time series and drag it on the canvas.
You’d see something like this…
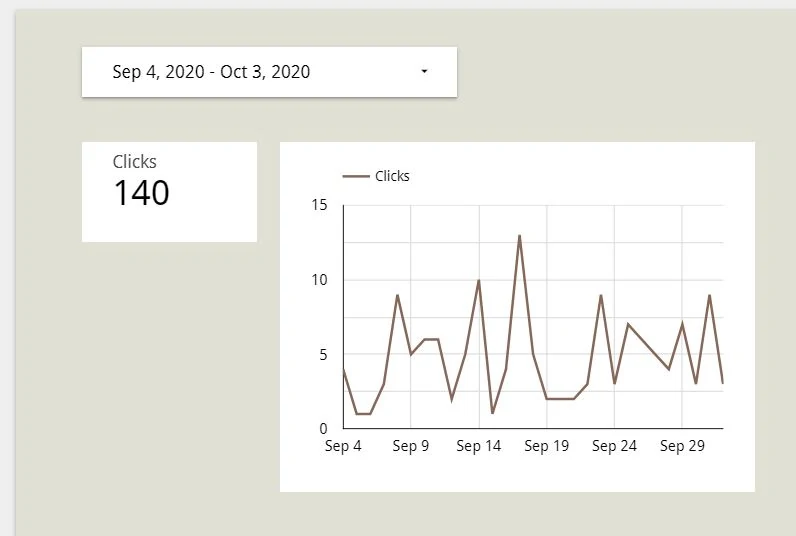
At this point, you now have a solid foundation for adding SEO metrics on the dashboard. You can add other metrics from Google Search Console. You can design the SEO dashboard further by using the navigation on the right.
Designing a comprehensive dashboard requires dedication and time. It requires a deep understanding on how to use Looker Studio. You may copy ready-made dashboards and templates from other websites. You’d see something like this in the end.
Done!
Bonus: SEO Keyword Analysis in Looker
This section is inspired by an article from notprovided.eu. A scatter chart is one of the built-in charts in Looker Studio. What makes the scatter chart effective with SEO is you see the relation of SEO metrics with each other. It’s an opportunity to find low-hanging fruit optimizations.
I’ll explain the usefulness of this chart but first, let’s add it to the SEO dashboard.
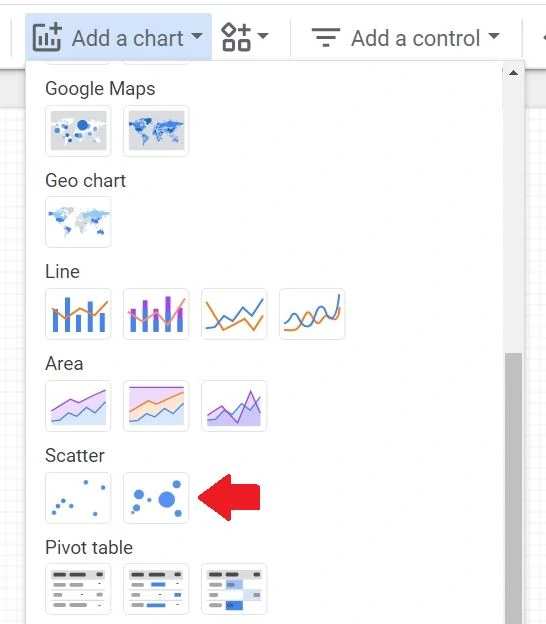
Adding The Scatter Chart
1 – Click Add a chart at the top. Click one of the scatter chart and drag it on the canvas.
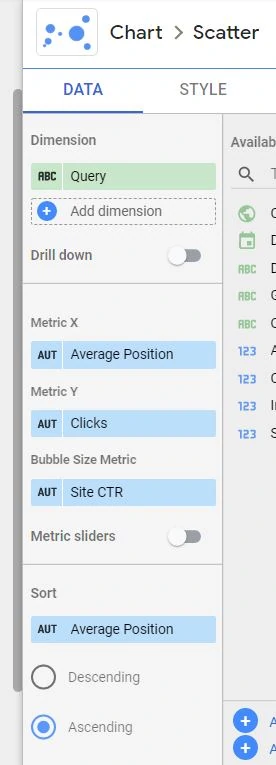
2 – Click the scatter chart. Follow the data filters for the navigation pane.
Dimension: Query
Metric X: Average Position
Metric Y: Clicks
Bubble Size Metric: Site CTR
Sort ascending for Average Position
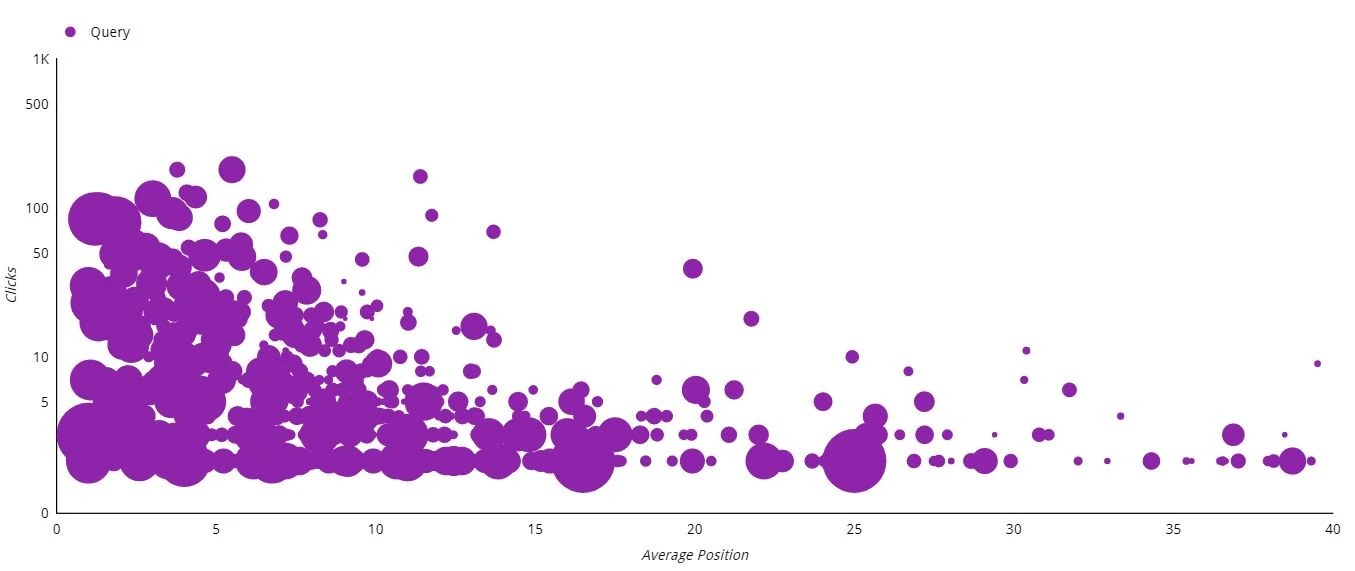
In this case, you use average position on the x-axis; clicks on the y-axis. How it looks will depend on the data that Google Search Console is collecting.
Understanding The Scatter Chart
What’s the function of this chart?
This shows the correlation of 2 metrics: Average position and clicks. In SEO, the higher the average position, the higher the odds of getting more clicks on Google.
This visualization shows the low hanging fruit keyword to optimize for. This lessens the unbearable data cleaning in Excel. This chart expedites the data collection side and helps you focus on data analysis.
What makes this chart useful?
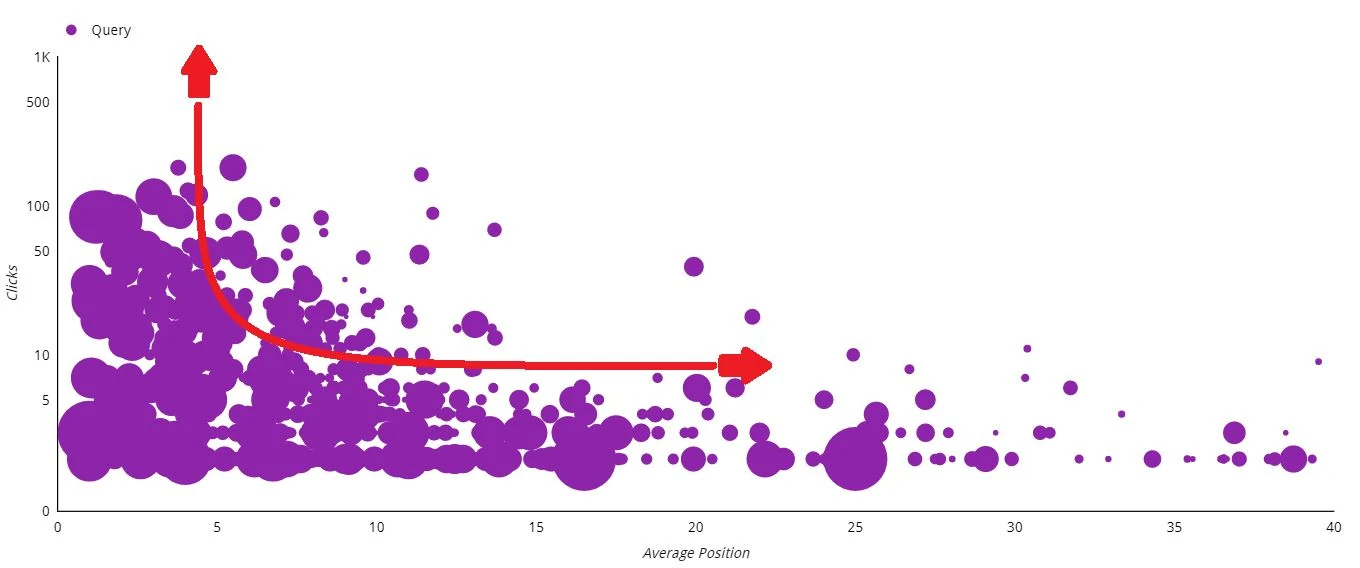
Let’s say that you’re looking for SEO keywords that will improve an SEO campaign. See the example below.
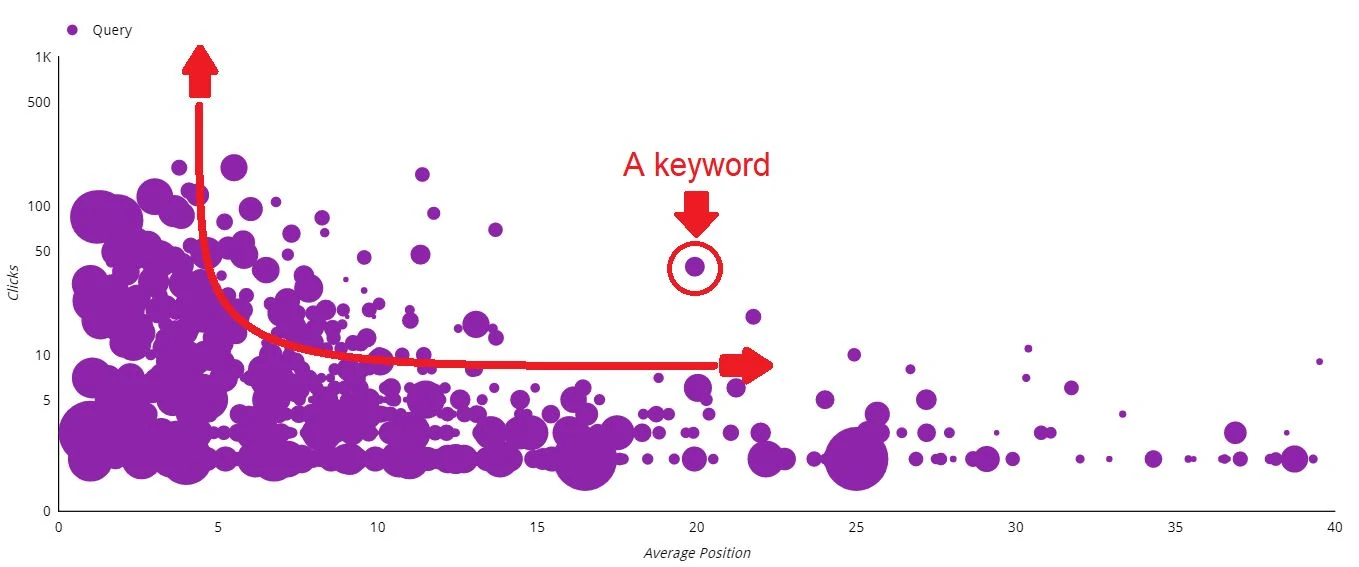
Analysis:
– The encircled SEO keyword has an average position of 20.
– For this average position, it gathers around 50 clicks.
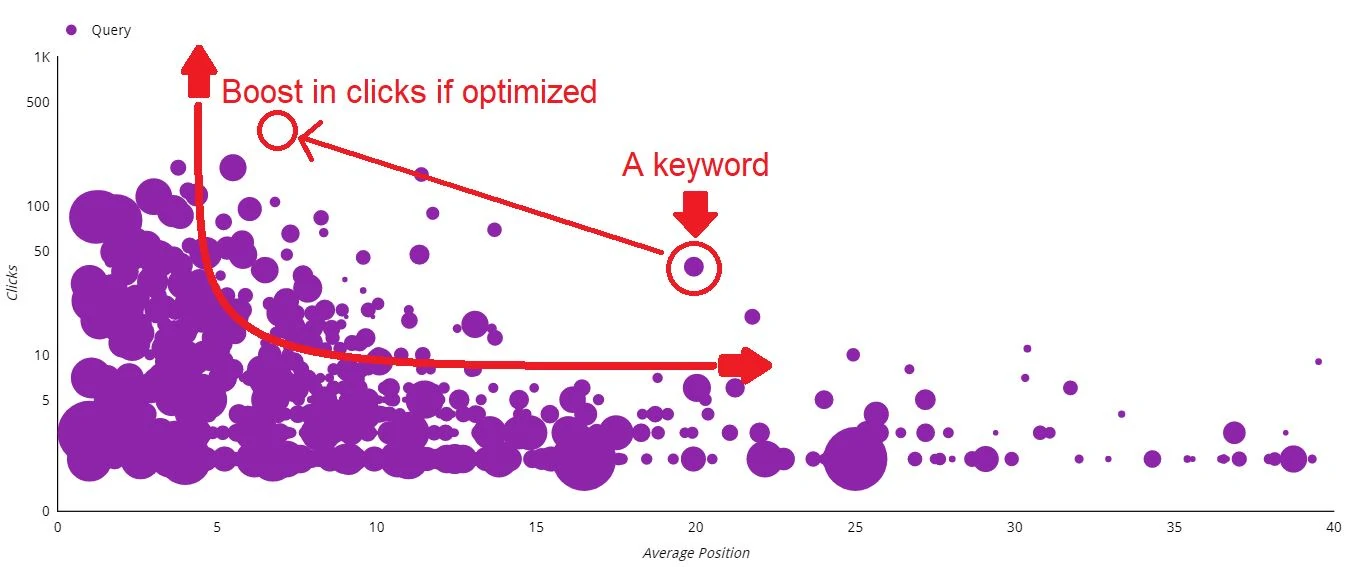
– If this keyword is optimized, the average position increases.
– When the average position ranks higher to the first page, the clicks and click-through rate increase. It will boost the clicks.
– Higher clicks and click-through rate translates to higher traffic on the website.
– There’s an opportunity to mine other SEO keywords that are relevant for the business.
You see these potential keywords in Looker Studio much faster in a more visual way. What’s great about the scatter chart is that the Looker Studio features are at your disposal. You can filter by metric range, change colors, other SEO keywords, device, etc.
Conclusion: Build a Dashboard for SEO Improvements
There are steps to create an interactive dashboard and measure SEO performance. Once the dashboard is created, the data analysis is easier and more actionable in the end.
Marketers measure sales funnels and blog performance. Building an SEO dashboard in Looker Studio is also super helpful. Measuring website performance on SEO is as critical. One can’t ignore the impact of search engines. This is one of the high traffic sources of the digital space.