
Empathy for users is critical for any digital analyst and conversion rate optimization specialist. User research is then put in the center of importance and gathering the data is an audacious task.
Despite most optimizers giving less focus on website metrics and user feedback (because most are prioritizing traffic acquisition), understanding user pain points are actually more important than driving traffic to the website.
So, how do optimizers start researching their website users?
Why use Google Analytics and Hotjar together?
There’s a method of knowing users: user research. In order to do this method well, there’s a quadrant that user experience specialists highlight. Many resources on the internet call this the 4 quadrants of user research.
What’s the 4 Quadrants of User Research?
The quadrant comprises of 2 sets: The first set is quantitative and qualitative data. The second set is behavior and attitudinal data.
There are different use cases where one quadrant is applicable to know users from a specific data source. The gif below shows this quadrant, as well as shows where Google Analytics and Hotjar are used.
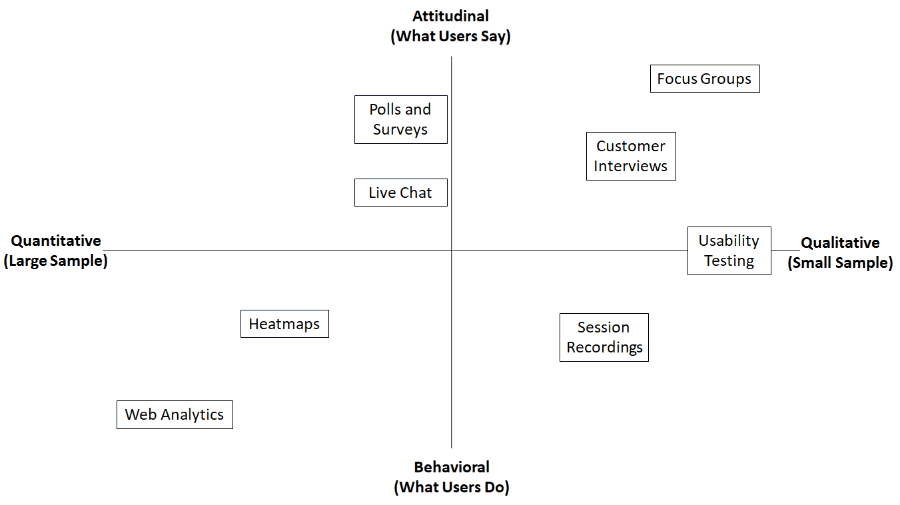
Google Analytics occupies one side of the quadrant and Hotjar occupies multiple quadrants. A person would already know the importance just by glancing where do these tools fall into.
Below are the reasons why using Google Analytics and Hotjar together is a cheat code or growth hack. Both tools start as FREE best of all!
#1 – Google Analytics is pure quantitative data while Hotjar is both qualitative and quantitative data
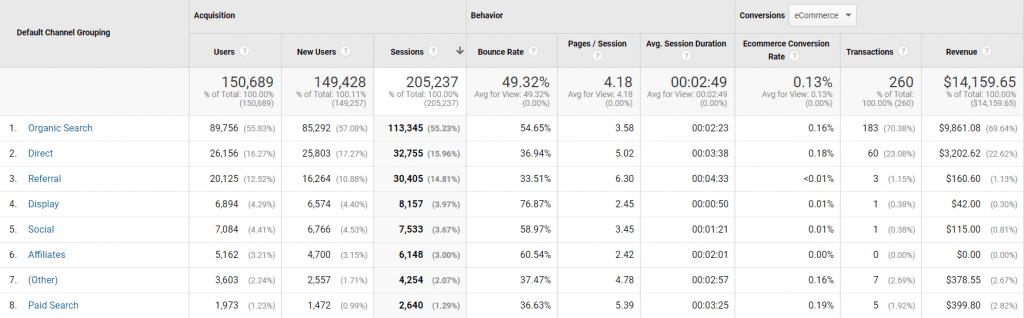
Google Analytics provides the below data to name a few:
-Traffic
-Devices
-Time on site
-Geographic and demographic data
-Bounce rate
-Goal funnel
So much data can be collected from Google Analytics. I’d say it’s the first step when I do conversion rate optimization audits. The large sample size of quantitative user data helps uncover major patterns in website behavior.
Hotjar has the features below that are also important:
-Heatmaps
-Polls and surveys
-Session recordings
-Form Analytics
Hotjar is both quantitative and qualitative data based on the user research quadrants.
Hotjar contains clickstream data from heatmaps. A page that has high page views contains on-page behavior, which is quantitative.
Polls and surveys tether on both quantitative and qualitative data because it will depend on the numbers of received responses. 3 responses could only warrant qualitative data as the insights are open-ended. But 30 responses might warrant quantitative data that might uncover patterns.
Session recordings are qualitative because each session recording has a story to tell about the user. Watching session recordings one by one is a chore and may not be indicative of the data sample, but important user data nonetheless.
#2 – Google Analytics is behavioral data while Hotjar is attitudinal data
Google Analytics highlights behavioral data or “what users do”. Since Google Analytics captures what users did on a website. This is past data that can be used to inform business decisions.
GA is bare metrics and deep numbers that represent user behavior. Google Analytics (with Google Tag Manager) can also track video plays or internal link clicks, which are considered behavioral.
Hotjar, on the other hand, highlights a combination of “what users say” and “what users do”. Heatmaps and sessions recordings capture what users did on the website.
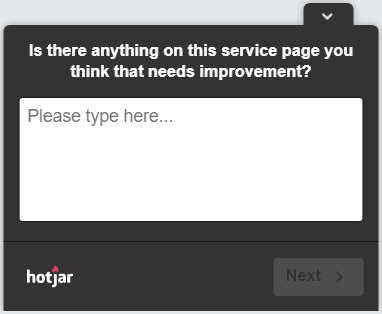
Hotjar polls an surveys are attitudinal data or “what users say”. Run a poll on a page you think that can provide great user feedback. Know when a page has missing information that users are looking for. Ask them how to improve your website. There’s valuable information there.

#3 – Google Analytics has “lagging” indicators while Hotjar has “leading” indicators
Google Analytics contains lagging metrics. Or in proper context, contains so much of it. I’d say it’s lagging metric because Google Analytics contains data that has already happened. Unless advanced statistics in data science is used to predict user behavior, Google Analytics reports data “as it is”.
Hotjar could be used to predict behavior patterns. When I say predict, I mean knowing what users want to give them what they need. Responses from polls are leading indicators that users want a feature from your offer.
An example is asking users what nearly stopped them from purchasing from your eCommerce store. This information is very valuable and a means to pivot into an unexpected direction.
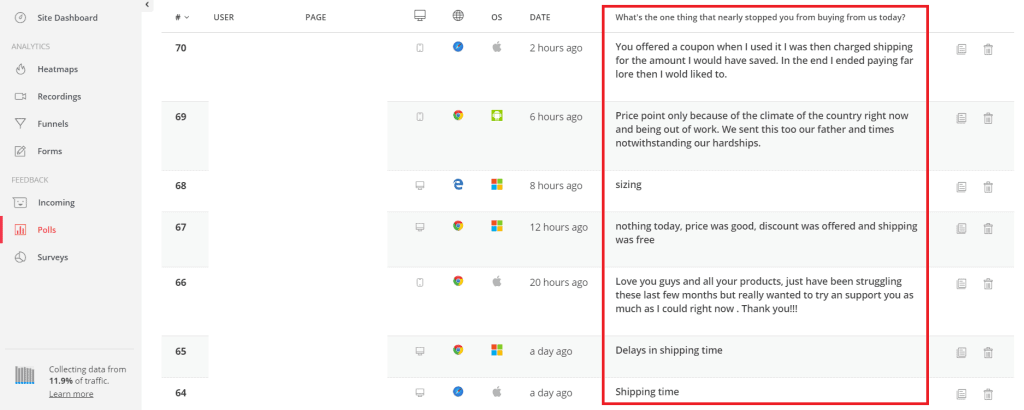
Knowing what uses say about the overall user experience of your website can garner surprising results. This type of user feedback can inform your marketing strategies, content, and other product offers.
#4 – Google Analytics answers what and where questions while Hotjar answers why questions
Hotjar gives context to Google Analytics.
While Google Analytics is very good at collating a mass of data, Hotjar provides a more human analysis. Hotjar can also be used to study human psychology in some ways.
Through session recording and polls/surveys there are lots to uncover about users browse a website. An eCommerce business would want to know if users swipe or click the different product images.
A heatmap can give context on why there’s a high exit rate on a page. Example: A call to action color may resonate with users more because this color gives the text more clarity.


#5 – Google Analytics gives “big picture” data while Hotjar gives “down to earth” data
Google Analytics takes a “bigger picture” approach while Hotjar takes a more “down to earth” approach. Google Analytics strikes me with “Oh, interesting!” moments whereas Hotjar strikes me with “Aha!” moments.
I take pleasure in uncovering user behavior through both these tools. I use Google Analytics as the first step to look for improvements. But I use Hotjar to create concrete action points. Both tools give similar data points, but different contextual points.
Here are ways on how I combine both tools:
-Google Analytics gives internal site search data while Hotjar gives page poll data
-Google Analytics gives ‘time on page’ data while Hotjar gives scroll map data.
-Google Analytics has funnel visualization while Hotjar has form analytics.
-Google Analytics (with Google Optimize) highlights A/B test results while Hotjar gives insights on how to increase conversions.
-I find pages with high traffic with high bounce rates in Google Analytics then put them on the Hotjar for heatmap data collection.
-I find pages (filtered by device and source) with high exit rates then watch sessions recordings of the same pages.
Conclusion: Google Analytics and Hotjar Echo Each Other’s Strengths

Websites should have Google Analytics and Hotjar at least. The combination of behavioral (what users do) and attitudinal data (whats users say) helps online businesses in more ways than one. This is a gold mine of user feedback data that inform sound business decisions.
Achieve empathy with these tools. Knowing more about your customers is a digital marketing cheat code or growth hack you can’t ignore. If you already have an abundance of data, consult with a digital analyst to help you make sense of it.
Your best source of information is your users.