
“How do I track blog traffic in Google Analytics”
-Content Marketing Manager
“I want to know how our blog is performing.”
“I want to know sales and revenue from our blog posts.“
Blog posts are the gold mine of website traffic. There’s a multitude of articles on how to increase blog traffic in the SEO world. That said, how do you measure blog performance in Google Analytics? More importantly, how do you measure sales coming from blogs?
Content marketers want to know how blog posts are contributing to the bottom-line. This is an important question not only for them but for any department. This is an important user metric similar to tracking internal links or Google Analytics funnels.
This is difficult to answer, unfortunately.
It’s a challenge to attribute top of funnel traffic but there are ways to uncover them. On top of that, you can’t avoid content managers and executives asking that question…more than a person would care to admit.
Below is a content marketer’s guide to measuring blog performance and sales in Google Analytics.
5 Ways To Measure Blog Performance in Google Analytics
Measuring blog performance and how it contributes to e-commerce sales IS possible. There are multiple ways on how to do this and requires digging into Google Analytics. Get important insights if you know your way around it.
Here are 5 ways to measure blog performance below are some methods to dig into Google Analytics data. Like other methods, each has upsides and downsides. Read on…
1 – Page Value
Definition:
The conversion value of a page (source).
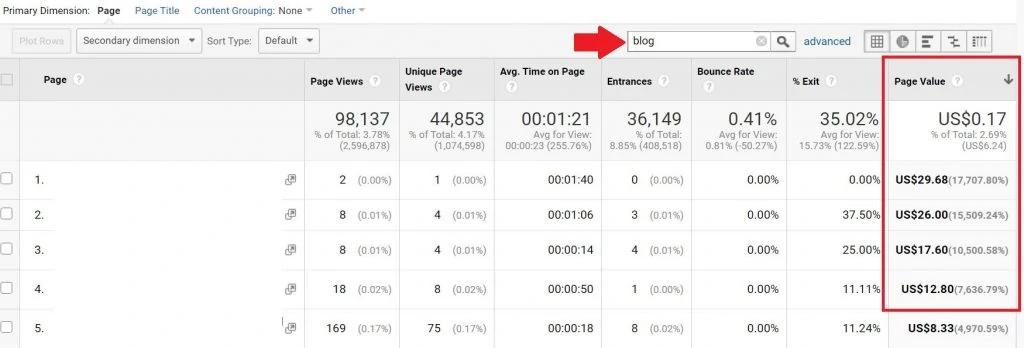
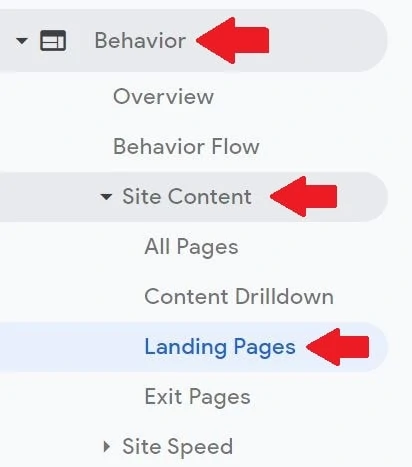
Step 1: Go to Behavior -> Site Content -> All Pages

Step 2: Filter the blog posts. In most cases, the blog posts are /blog/ in the URL structure. Check them on your website.
Insights:
Page Value assigns a value to a specific page when that page was part of a user journey before an e-commerce sales or any conversion. This is one of the ways to measure blog performance of a website in Google Analytics.
When the Page Value has an assigned value, this means that the page contributed to a conversion to a certain extent. Likewise, when the Page Value for that is zero, this page was not part of the user journey.
In this example, the pages with a high Page Value has low pageviews. It’s best to bring more exposure to these pages. The pages might have some influence on the buying decision of the user. These pages can be promoted via marketing or give them exposure on the website for higher clicks.
Downside:
Page Value doesn’t give the actual transaction and revenue figure. The number is divided among the pages the user interacted with.
It’s Transaction Revenue + Total Goal Value divided by Unique Pageviews. This means that you don’t get the whole sales figure of a purchase that started from a blog post.
In addition, funnel goals and enhanced e-commerce should be installed for this metric to populate.
2 – Landing Page Report
Definition:
The pages that visitors entered the website (source).
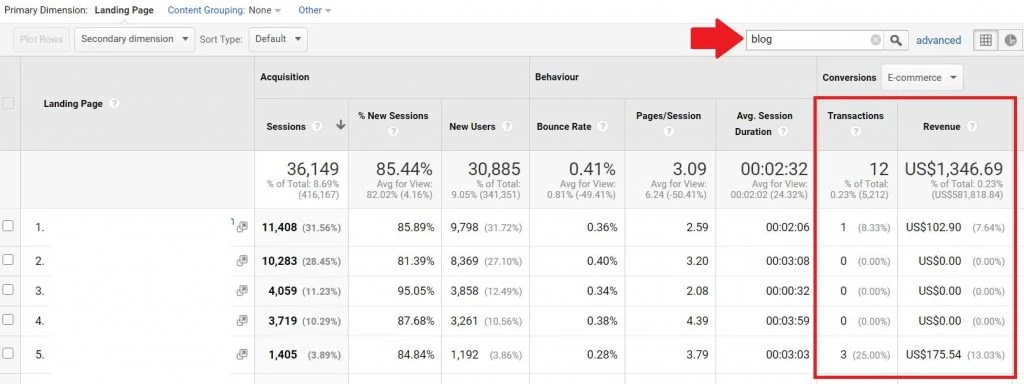
Step 1: Go to Behavior -> Site Content -> Landing Pages
Step 2: Filter your blog posts. In most cases, the blog posts are /blog/ in the URL structure. Check them on your website.
Insights:
This is a standard dashboard to look at. It’s one of the standard reports to know what blog pages users landed on that led to a conversion or a transaction. It’s more straightforward than Page Value because it’s “visit-level”. The dashboard also pits the landing page URL to the Transaction, Revenue, or any Goals set.
In this example, the blog pages contributed 12 Transactions and $1,346.69. Blog posts have low conversion rates because most users skim the blog post only. Most users read the blog post and exit the website without browsing further, which is normal.
Downside:
Users go back to the website. The attribution for Landing Page reports is “last-click” attribution. This means that even though there’s no Transaction or any conversions on this Landing Page report, doesn’t mean it didn’t contribute conversions on a later visit.
3 – Custom Segments
Definition:
A subset of sessions or users that share common attributes. Segments allow to isolate and analyze groups of sessions or users for better analysis (source).
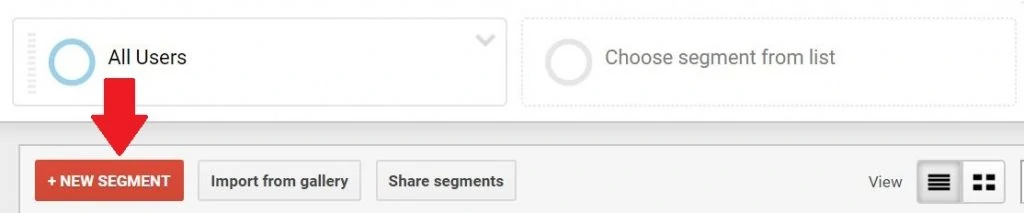
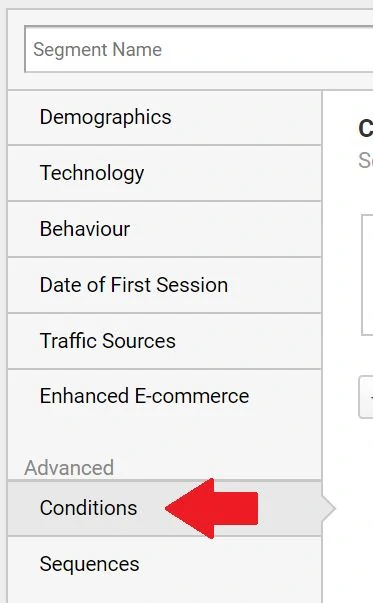
Step 1: Scroll up top of page and click + Add Segment -> Click + New Segment

Step 2: Click “Conditions”
Step 3: Follow the screenshot below.
-Filter: Users | Include
-Page contains [your blog]
-Click AND
-Transactions | per user > 0
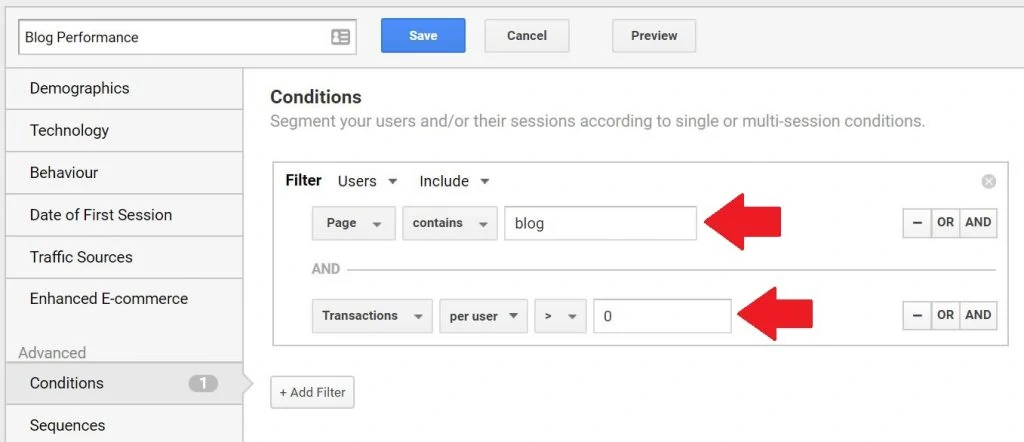
Step 4: Name your Segment. Click Save.
Insights:
Segments are ways of collecting specific sample data. This particular segment can be carried as you traverse through other Google Analytics dashboards.
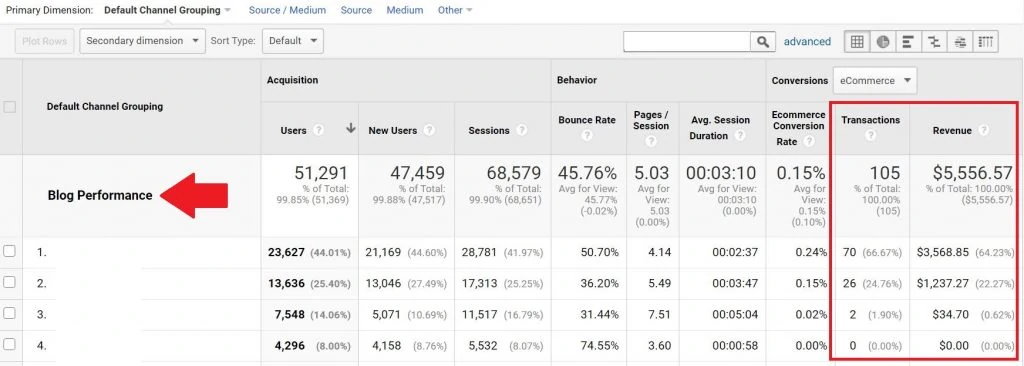
In this example, there were 70 transactions that contributed by blog posts from the first Default Channel Grouping. The second Default Channel reported 26 transactions that blog posts were a part of the user journey.
Go to another Google Analytics report (devices for example) and the custom segment is still in place and the metrics are still the same. The segment filters the report on whatever the report you’re in. The Primary Dimension on the left side is the main driver of comparison.
Downside:
There are cases of fragmentation with segments. Too many conditions and sequences create misleading data or the data might not make a lot of sense. It’s also tedious to put Sequences and making sure each one makes sense.
Segments (especially Sequences) are sometimes used too much that they are “too clever”. They warrant too many workarounds to the detriment of data quality. The data decreases validity once more sequences are added.
4 – Multi-Channel Funnels Report
Definition:
The Multi-Channel Funnels reports are generated from conversion paths, the sequences of interactions during the 90 days that led up to each conversion and transaction (source).
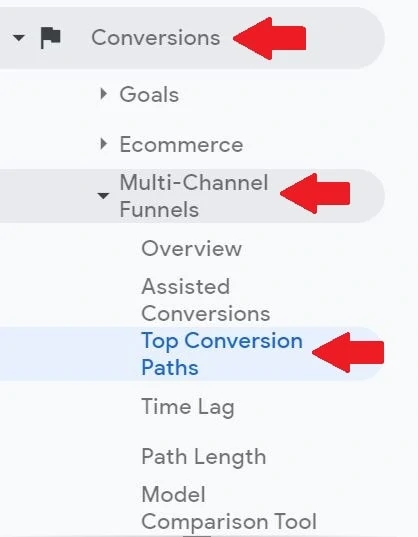
Step 1: Go To Conversions -> Multi-Channel Funnels -> Top Conversion Paths
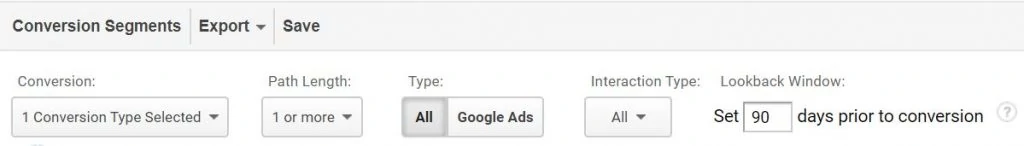
Step 2: Scroll up the page and follow the filters:
-Conversion: “Transactions” or any goal
-Path Length: 1 or more
-Interaction Type: All
-Lookback Window: 90 days prior to conversion
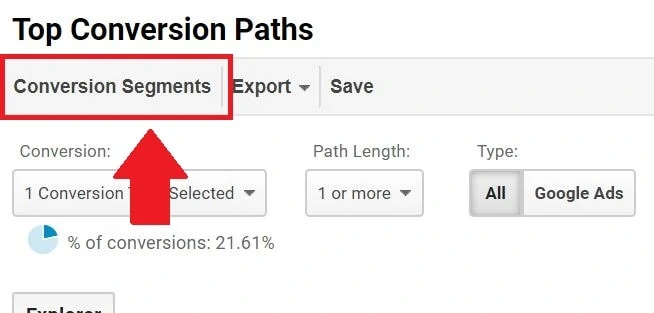
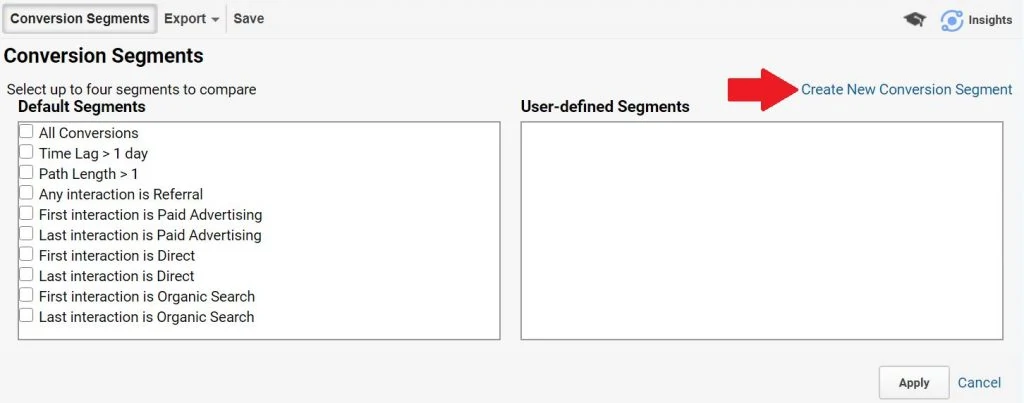
Step 3: Click “Conversion Segments”. Click “Create New Conversion Segment”
Step 4: Follow the screenshot
-Include
-First Interaction from
-Landing Page URL containing [your blog]
-that occurred Greater Than 0 times
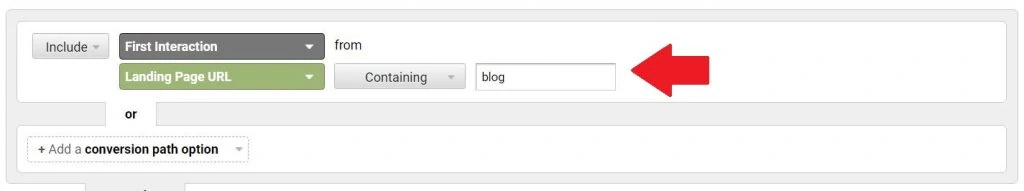
Step 5: Name your Segment. Click Save
Insights:
This report highlights the different multi-touch points of the user journey prior to converting. It attributes (and gives credit) to marketing channels that contributed to a conversion (whether a goal or sale).
What makes this report powerful is it’s a way to see how certain data sources (pages or marketing channel) ACTUALLY contribute to KPIs within 90 days.
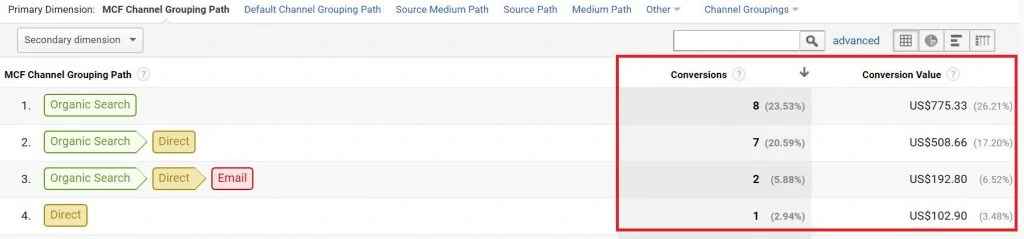
As an example on row 3: There were 2 conversions that are blog posts as the first interaction from Organic Search, that visited again on Direct, then visited again on Email and converted. This is within the 90 day period. This is how to analyze multi-channel reports.
Now click “Other” and choose “Landing Page URL Path” as a Primary Dimension…
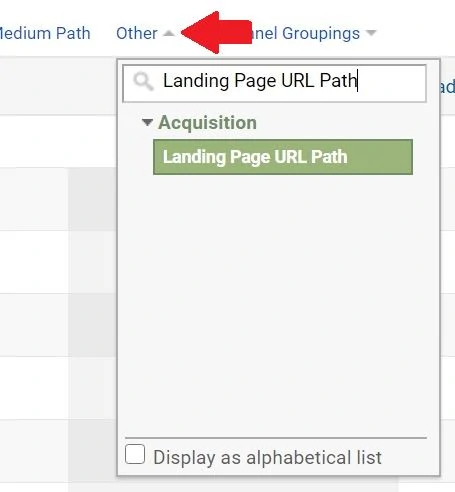
This report proves the point. It highlights that users, which the blog post as a first touchpoint, converted on a later visit within 90 days on a different channel. The insights here are more valuable because it illustrates different touchpoints of the user journey in relation to blog posts.
The same analysis can be done with “Any Interaction”, “Last Interaction” and other custom segments like campaign.
Downside:
This is advanced to most. Multi-channel funnel reports and attribution is the archnemesis of a web analyst, which requires on-going consulting to validate the data. This report is not a “quick glance” report that to suddenly get insights from.
Another downside is multi-channel funnel reports can’t be visualized in Google Looker Studio. This means manual reporting is required. It’s also possible this report warrants more questions than answers from executives.
5 – Events
Definition:
Events are user interactions with content that can be measured independently from a web-page or a screen load (source).
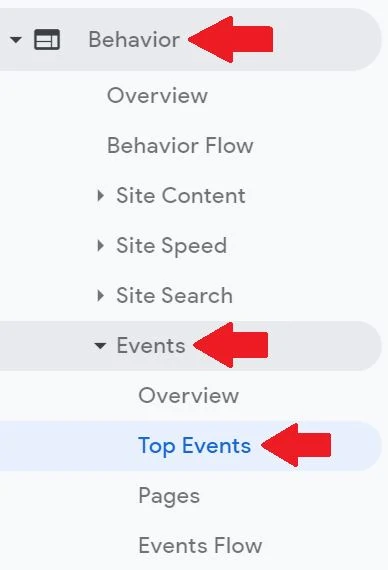
Go to Behavior -> Events -> Top Events
Insights:
The events are somewhat different from the rest. The metrics shown for Events are not sales or revenue directly, but more on “hits” on whatever user activity. Implement event tracking through Google Tag Manager to see the effectiveness of this.
These are the events to measure as blog performance:
–Internal links
-Video plays
-Scroll depth
-Newsletter subscriptions
These events don’t translate to sales and conversions directly, but it’s equally important to understand website traffic better. The Events method above is the prerequisite for creating micro-goals.
The most important contribution to Events is the creation of micro-goals in Google Analytics. These micro-goals are secondary goals that are not too strict. Blog sales and revenue are too extreme for KPIs and these micro-goals alleviate the performance requirements.
Downside:
Events don’t directly measure blog sales but it can still measure blog performance. It doesn’t provide as robust data as the other methods above provide. Come up with good insights and proper direction if there’s a measurement plan with open collaboration across functional departments.
Conclusion: Measuring Blog Performance is Not a Straight Line
When a blog is not contributing to revenue, perhaps it’s best to measure micro-goals. Micro-goals are secondary goals of a website. These goals are much broader are not too rigid in terms of KPI.
There are other metrics to look at like page views, avg. session duration, bounce rates, and others. It’s best to have a measurement plan and have a sit down with content directors on KPIs.
Measuring blog performance like sales and revenue is not linear but doable. Blogs are a great way to increase brand awareness and an important part of the marketing channels. The customer journey is longer with blog posts, but it shouldn’t be neglected on how it contributes to the bottom-line.
Hire a google analytics consultant if the data is too overwhelming.